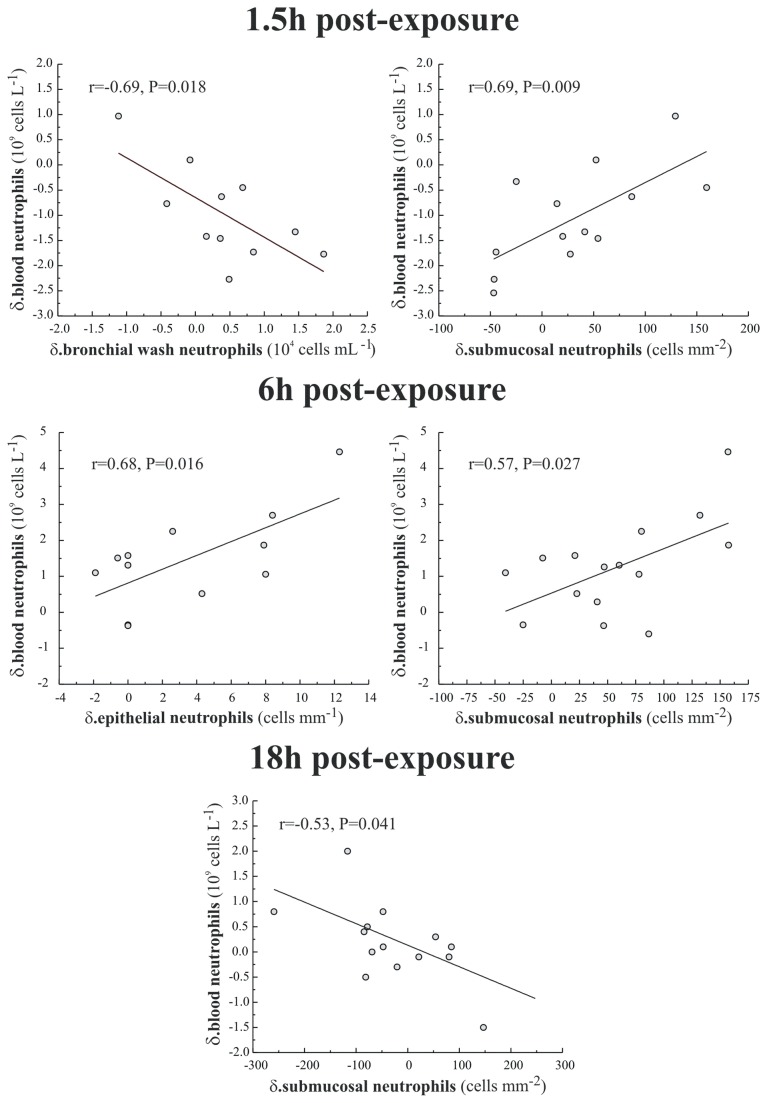
Figure 5. Significant associations (Pearson correlation) between the observed systemic neutrophil response at 1.5, 6 and 18 hour post-exposure (parameter post ozone minus that post air) with that observed in the airway lumen (sampled by BW), the bronchial airway epithelium and submucosa at the equivalent sampling time point.
The Pearson correlation coefficient (r) and the 2-tailed significance (P) for each association is illustrated together with a linear regression through the data.

