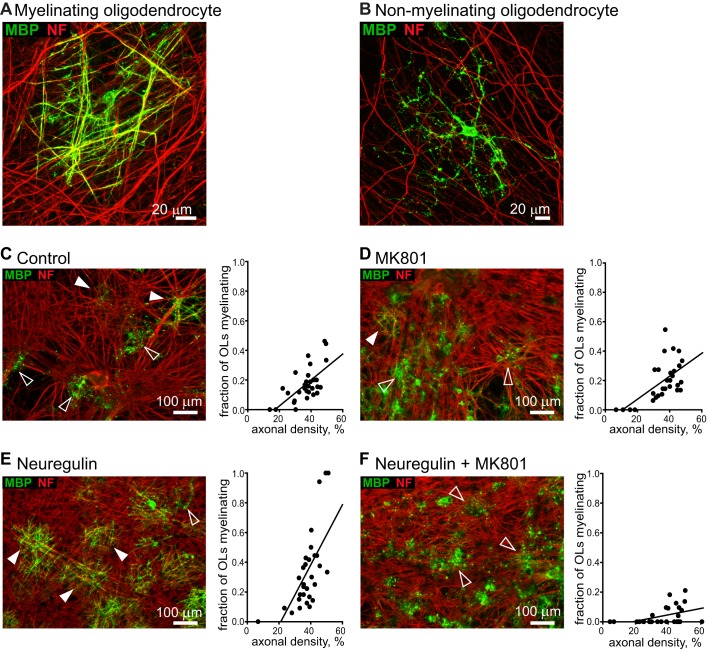
Figure 1. Effect of NRG and NMDA receptor block on myelination.
(A, B) High-magnification views of a myelinating oligodendrocyte (A) with MBP (green) expressed in processes wrapping around axons expressing NF 160/200 (NF, red), and of a nonmyelinating oligodendrocyte (B) with MBP expressed (in a more patchy and often diffuse manner) in processes that are not aligned with axons. Myelination was quantified as the fraction of all MBP-expressing oligodendrocytes that provided a thick straight myelin sheath to at least one axon. (C–F) Myelinating processes (MBP, green) wrapping DRG axons (NF, red) in control conditions (C), in the presence of MK-801 (D), in the presence of NRG (E), and in the presence of NRG and MK-801 (F). Filled and open arrows show some myelinating and nonmyelinating oligodendrocytes. Graphs show fraction of oligodendrocytes that are myelinating, versus fraction of area occupied by DRG processes, for 30 images of each coverslip from which the specimen images shown were taken, best fit with a linear dependence of myelination on axon density.

