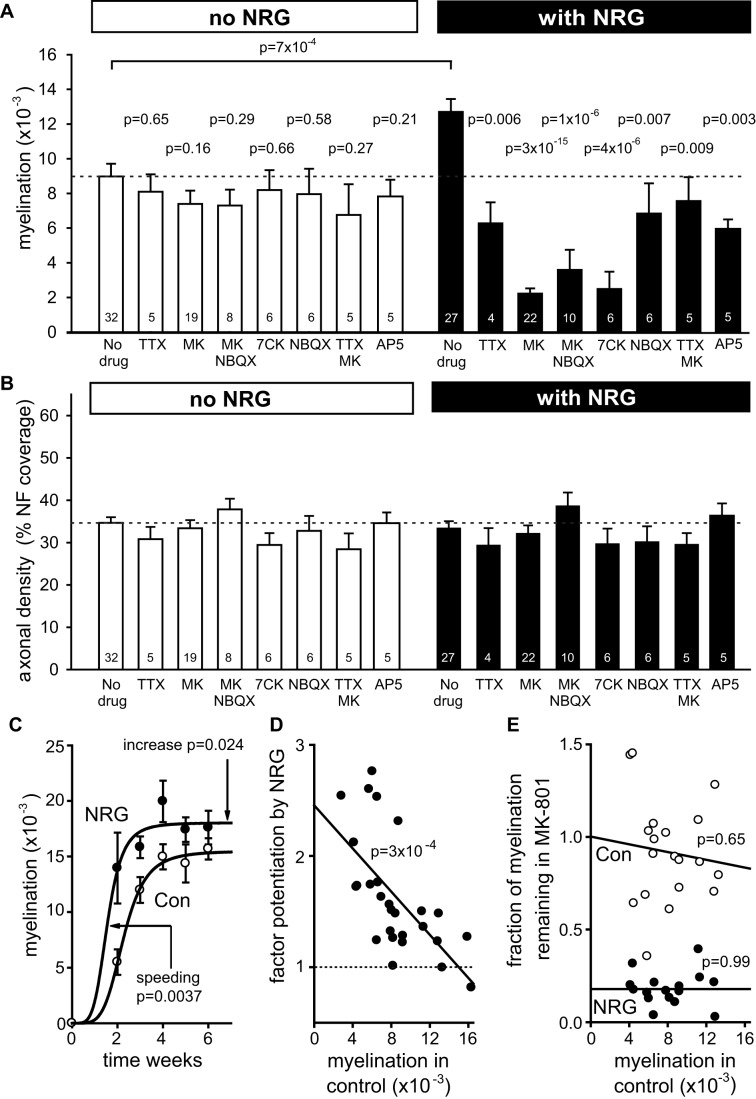
Figure 2. NRG switches myelination to an activity- and NMDA receptor-dependent programme.
(A) Mean myelination parameter (the value of A from eqn. 1 of the Materials and Methods) from experiments as in Figure 1 for different conditions (number of experiments shown on bars). For No NRG, ANOVA indicated no significant differences across all bars (p = 0.79); p values from t tests are for comparison with control. For With NRG, ANOVA showed significant differences across all bars (p<0.0001); p values (from Holm–Bonferroni post hoc test) are for comparison with NRG alone (comparison between conditions with and without NRG: TTX versus NRG+TTX p = 0.29; MK versus NRG+MK p = 6×10⁻⁷; MK+NBQX versus NRG+MK+NBQX p = 0.14; 7CK versus NRG+7CK p = 0.02; NBQX versus NRG+NBQX p = 0.65; TTX+MK versus NRG+TTX+MK p = 0.72; AP5 versus NRG+AP5 p = 0.85). (B) Axon density (fraction of image pixels labelled for NF 160/200) for the conditions in (A) (ANOVA showed no significant differences, p = 0.19). (C) Myelination in control and NRG at different times after plating OPCs onto DRG cells (5–7 cocultures per point). Plots are myelination (M) as a function of time (t) where M = Mmax.tn/(tn+Tn) with n fixed at 4.7 (best fit for control) and best fit values were Mmax = 0.0180 (NRG) or 0.0155 (Con) and T = 1.56 (NRG) or 2.28 (Con) weeks. The p values are shown for the increase of Mmax and decrease of T in NRG compared to control. (D) Potentiation of myelination by NRG as a function of the level of myelination in control conditions (each point is one individual coculture). (E) Fraction of myelination remaining in MK-801 as a function of the level of myelination in control conditions (each point is one individual coculture; variability in the data reflects taking the ratio of two variable levels of myelination), in the absence (Con) and presence of NRG. See also Figure S2 and S3.

