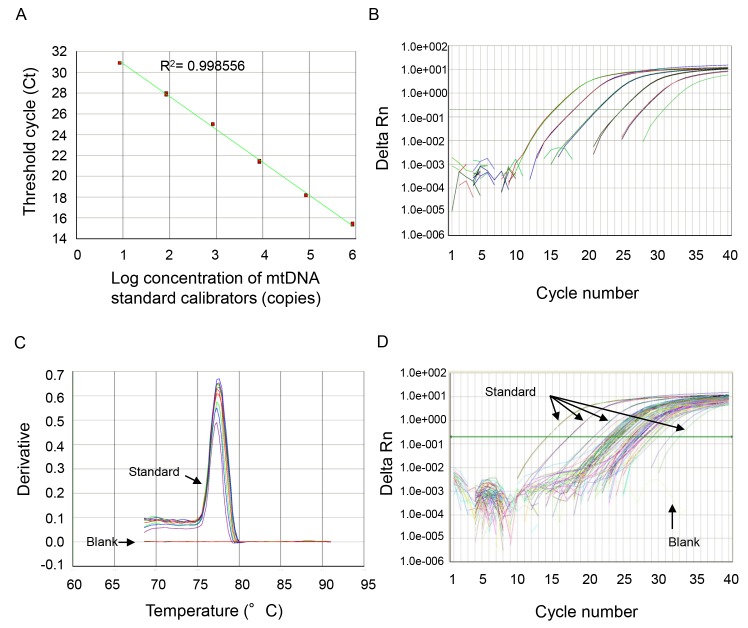
Figure 1. Representative standard curve, amplification plot, and dissociation curve, and amplification plot from the patients' samples.
(A) NADH dehydrogenase 1 complementary DNA was serially (1∶10) diluted to prepare a series of calibrators (mtDNA standard) with known DNA copy number. The assay was linear over the range (8.48–848000 copies) of DNA copy numbers (R 2 = 0.997866). (B) The amplification plot (ΔRn versus cycle [log] view) shows no irregular amplification for the standard diluents (848,000, 84,800, 8,480, 848, 84.8, 8.48). (C) The dissociation curve shows a single melting temperature of the specific products generated with standard template. Also, there is no melting temperature observed in the no-template control wells (blank). These dissociation curves indicate that the reactions are free of primer-dimer or any other spurious products. (D) Similar amplification plots were observed after qPCR using patients' samples. The amplification curves generated from human samples were paralleled with the curves from standards and were in the range of amplification plots for standard diluents.

