
Figure 4. Receiver operating characteristic curves, mtDNA, and death in ICU patients.
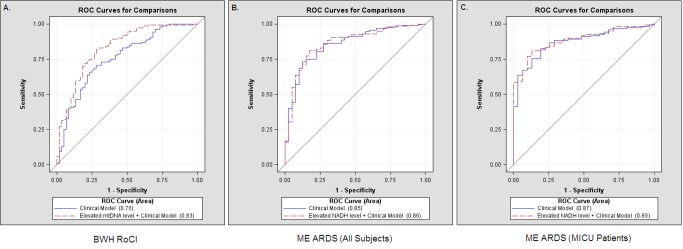
Comparisons of receiver operating characteristic (ROC) curves for a clinical model (including age, gender, race/ethnicity, APACHE II score, and sepsis) (solid lines) and a clinical model with an mtDNA level ≥3,200 copies/µl (dashed lines) to predict 28-d mortality in ICUs. (A) The area under the curve was 0.76 for a clinical model and was 0.83 for a clinical model with an mtDNA level ≥3,200 copies/µl in the BWH RoCI cohort. (B) The area under the curve was 0.85 for a clinical model and was 0.86 for a clinical model with an mtDNA level ≥3,200 copies/µl in the ME ARDS cohort when all patients were included. (C) The area under the curve was 0.87 for a clinical model and was 0.89 for a clinical model with an mtDNA level ≥3,200 copies/µl in the subpopulation of ME ARDS MICU patients.