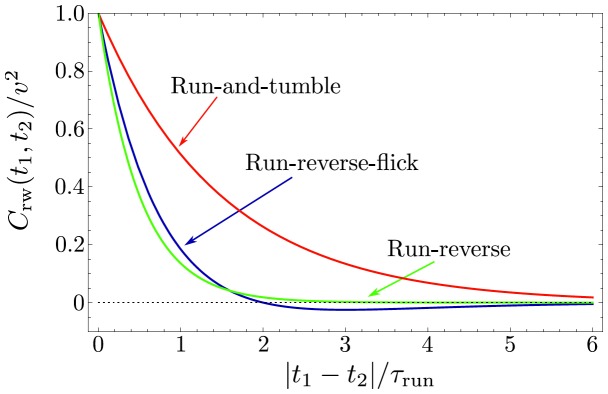
Figure 3. Velocity correlation function.

The normalized velocity correlation function  is plotted as a function of dimensionless time
  . The curves are shown for run-and-tumble of E. coli with persistence parameter
  (red), run-reverse with
  (green), and run-reverse-flick with alternating
  and
and  (blue). The analytical expressions are given in Eqs. (12) and (21), respectively.
