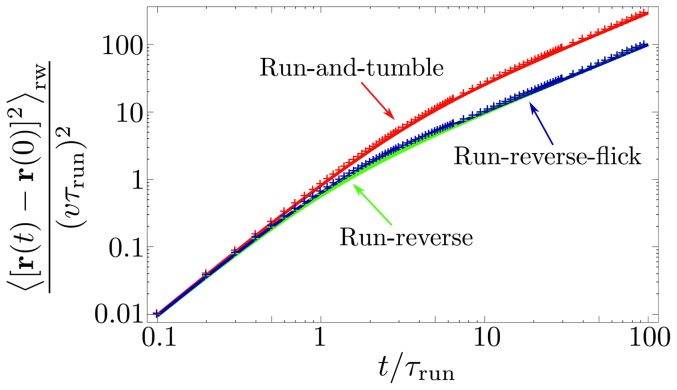
Figure 4. Mean squared displacement (MSD).
The curves of the normalized MSD versus dimensionless time  correspond to E. coli's run-and-tumble with
  (red), run-reverse with
  (green), and run-reverse-flick with alternating
  and
and  (blue). The analytical expressions are given in Eqs. (13) and (22), respectively. The crosses are obtained from numerical simulations and fully agree with the analytical results.

