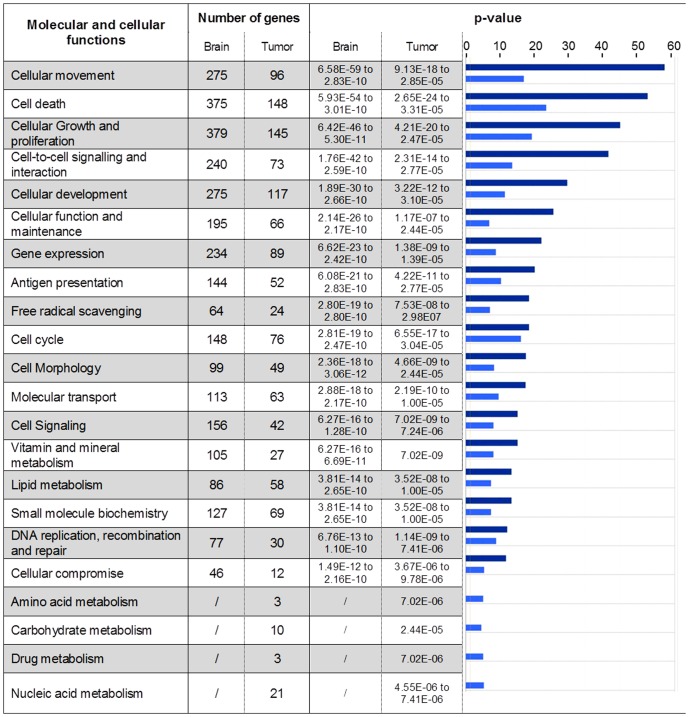
Figure 5. Molecular and cellular functions constituting the MRT response.
Genes with a significantly modified expression in brain or tumor 6-values (−log(p-value)) are illustrated for each function. The p-values associated with brain (dark blue) and tumor (light blue) are represented using histogram in the right-hand column. The p-values were calculated using the right-tailed Fisher's exact test in IPA.

