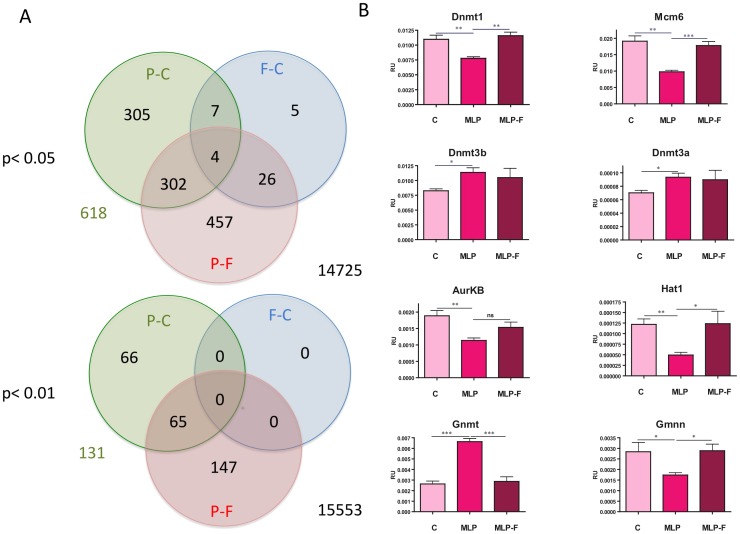
Figure 1. Differentially expressed genes in maternal undernutrition model.
(A) Venn's diagrams showing the number of differentially expressed gene probes in comparisons MLP vs. C (P-C), MLP-F vs. C (F-C) and MLP vs. MLP-F (P-F) at FDR 5% (top) and FDR 1% (bottom). Number of gene probes whose expression was unaltered is indicated in black (right). Numbers of altered gene probes in MLP-C contrast at different FDR are indicated in green (left). (B) qRT-PCR mRNA analysis for 8 genes: Dnmt1, Dnmt3a, Dnmt3b, Aurkb, Mcm6, Hat1, Gnmt and Gmnn. Results are given in relative units, as ratio of number of copies in assessed gene and housekeeping gene GAPDH. × P<0.05; ×× P<0.01; ××× P<0.001. ns P>0.05.

