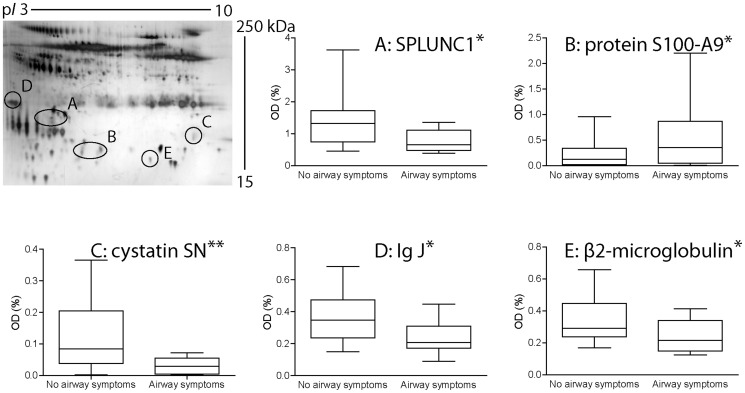
Figure 2. Protein changes in nasal lavage fluid among subjects with airway symptoms compared to subjects without airway symptoms.
Proteins were separated with 2-DE, visualized with silver staining and identified by mass spectrometry. Quantitative data (optical density, OD) represent median, interquartile range and max/min-values for 8 subjects with airway symptoms and 20 subjects without airway symptoms. A nasal lavage fluid 2-DE protein pattern is shown in the upper left corner. The proteins were separated according to size from top to bottom (250-15 kDa) and according to isoelectric point from left to right (3–10). *p≤0.05, **p≤0.005 (Mann-Whitney U test).

