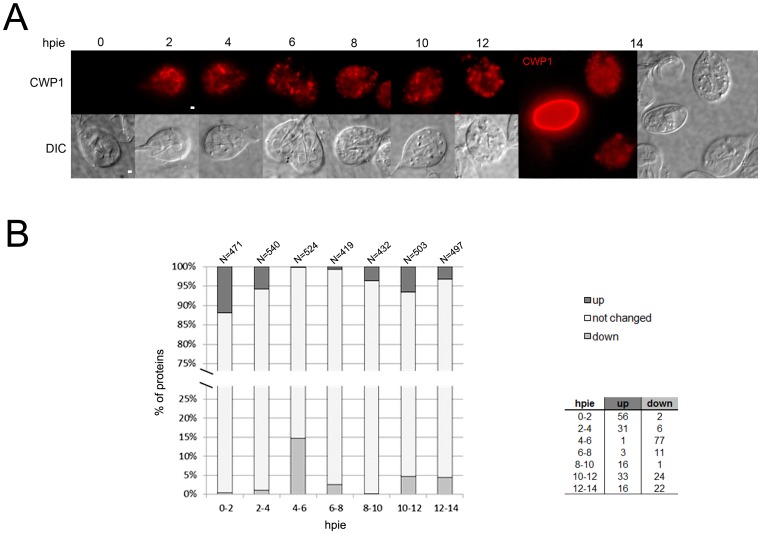
Figure 1. Proteome profile of G. lamblia trophozoites analyzed at 0, 2, 4, 6, 8, 10, 12 and 14hpie.
(A) Upper row: Wide-field immunofluorescence microscopy analysis of CWP1 (red) localization in representative G. lamblia trophozoites induced to encyst over a 14 hr time period using the 2-step encystation method [29]. Between 2 and 4hpie, CWP1 is mainly localized to the ER. From 6 to 8hpie, ESVs emerge and develop, reaching the partitioning phase for CWPs between 10 and 12hpie. At 14hpie, cyst production is already under way within a population of late-encysting cells. Lower row and far right: corresponding bright-field images. Condensed-core ESVs become visible at 8hpie (white arrow). hpie: hours post induction of encystation. Scale bars: 1 µm. (B) Regulation of protein abundance within 2-hour transitions during the 14 hour encystation time-course experiment. Based on relative quantitative information by nSpC for each identified protein (further information in Table S1), protein abundance across each transition was either up-regulated (up), down-regulated (down) or did not change. The total number of proteins for each dataset is indicated above each bar. Transitions between 0-2-4 and 4-6-8hpie showed a trend for increased and decreased protein abundances respectively while the last 4 hours of encystation were marked by a slight tendency of increased abundances. The associated table reports the exact number of proteins in each category. hpie: hours post induction of encystation.

