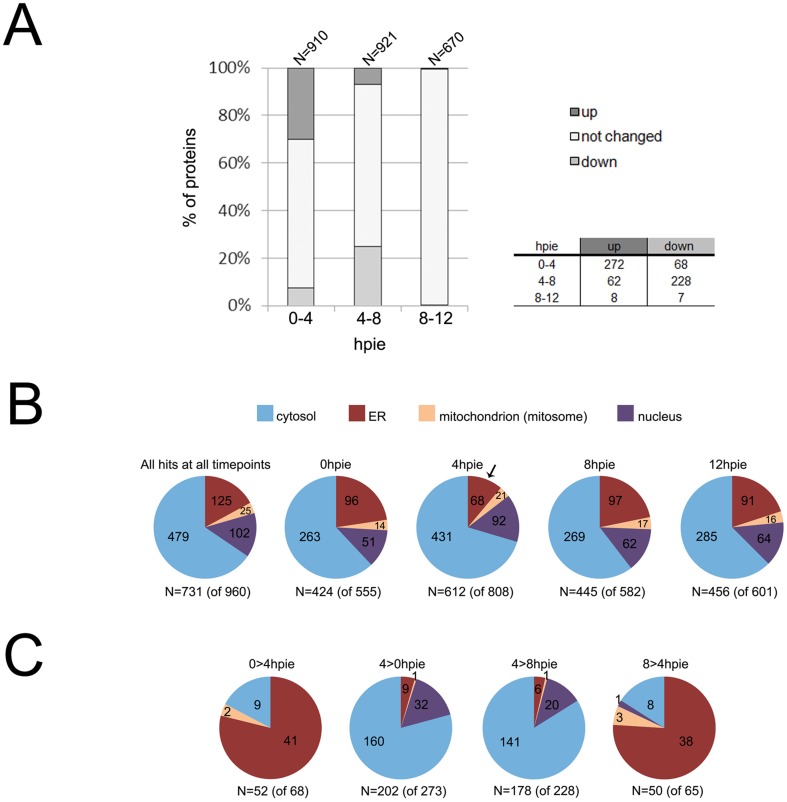
Figure 3. Protein abundance and predicted subcellular distribution of G. lamblia trophozoites analyzed at 0, 4, 8 and 12hpie.
(A) Comparison of changes in protein abundance between 0 and 4hpie (0–4), 4 and 8hpie (4–8) and 8 and 12hpie (8–12). Based on relative quantitative information by nSpC for each identified protein (further information in Table S2), protein abundance across each 4 hour interval was either up-regulated (up), down-regulated (down) or did not change. The total number of proteins for each dataset is indicated above each bar. In total, the abundance of 342 and 303 proteins was significantly increased or decreased between two different time-points. The 4hpie time-point presented the highest number of both detected and significantly regulated proteins, while only few changes were recorded at 12hpie compared to 8hpie. The associated table reports the exact number of proteins in each category. hpie: hours post induction of encystation. (B) Target P and NucPred predictions for the subcellular distribution of all proteins detected at each time-point. The predicted contribution of mitochondrion (mitosome), nucleus and cytosol localized proteins was similar across time-points. In contrast, the number of proteins predicted to traffic to or through the ER was reduced by ca. 50% at the 4hpie time-point (black arrow). The number of proteins which satisfied both algorithm thresholds for reliability is indicated beneath the respective pie-chart; in brackets, the overall number of proteins for each dataset is indicated. hpie: hours post induction of encystation. (C) Target P and NucPred predictions for the subcellular distribution of significantly regulated proteins between 0 and 4 and 4 and 8hpie. Proteins more abundant at 4hpie compared to 0 and 8hpie (4>0hpie and 4>8hpie) were significantly depleted for predicted ER-targeted hits and enriched for putative nuclear targeted proteins. This view was almost reversed for proteins with higher abundance at 0 and 8hpie compared to 4hpie (0>4hpie and 8>4hpie). The number of proteins which satisfied both algorithm thresholds for reliability is indicated beneath the respective pie-chart; in brackets, the overall number of proteins for each dataset is indicated. hpie: hours post induction of encystation.

