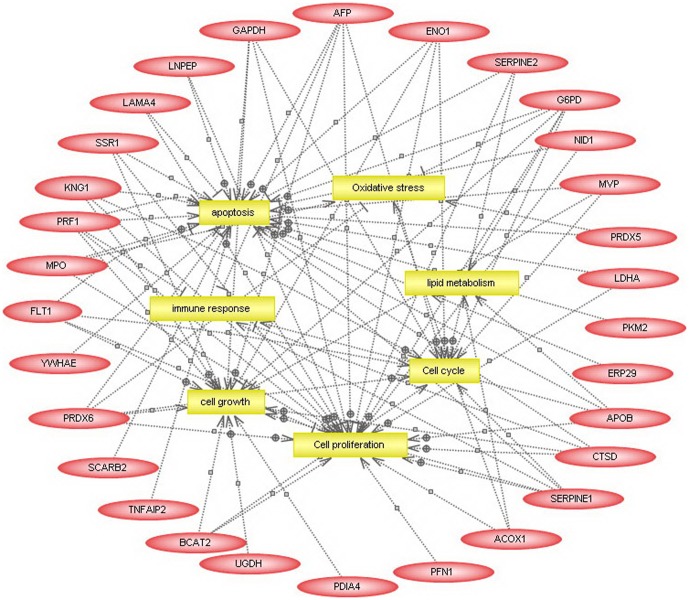
Figure 2. Bioinformatic analysis of differentially expressed proteins in the placental tissue from pregnant women with ICP and healthy pregnant women predicted by PathwayStudio™.
Analysis of the cellular pathways affected by the differentially expressed proteins was performed using the PathwayStudio software. Proteins are shown as red ovals, regulated processes are represented by yellow squares. Regulation events are displayed with arrows and documented by literature citations.

