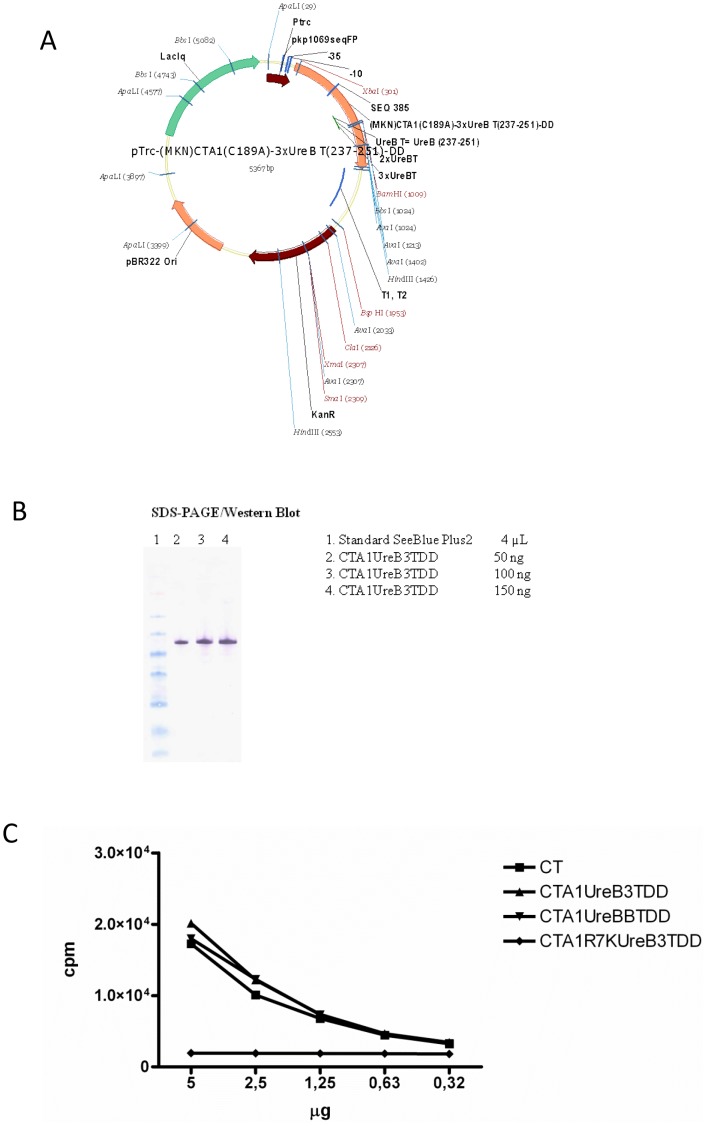
Figure 2. Schematic drawing of the CTA1-DD plasmid vector with incorporated 1–3 UreB 237–251 epitopes in single or tandem repeats.
(A). Protein analysis was performed with SDS-PAGE on purified material from the E.coli expression system and concentrations were determined using the Bio-Rad DC protein assay, according to the manufacturer's instructions. Western blot analysis using HRP-labelled anti-DD antibodies (B). The ADP-ribosylating ability of CTA1-UreB3T-DD, but not the mutant inactive CTA1R7K-UreB3T-DD protein, was comparable to that of CT at a molar level, as shown in the NAD-agmatine assay diagram (C). These are representive data from at least 5 identical experiments giving similar results.

