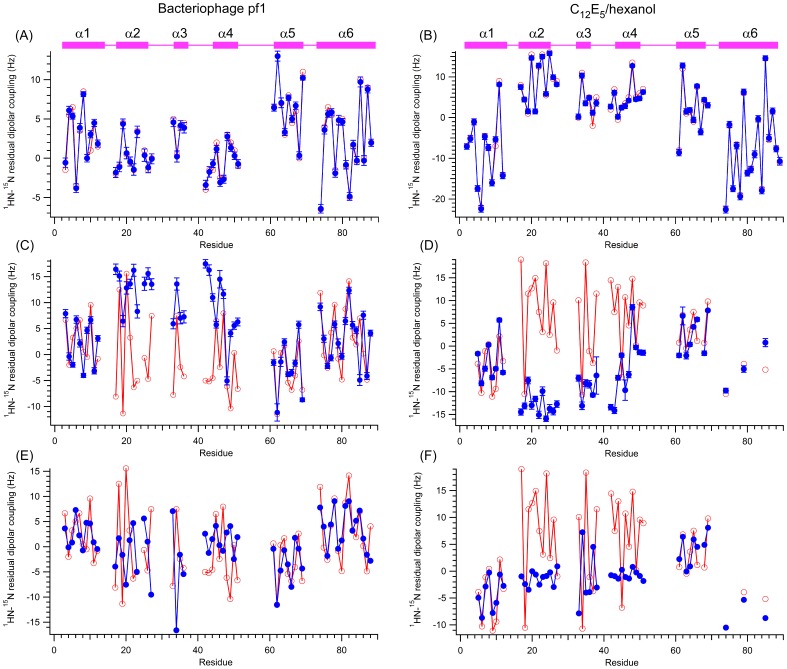
Figure 1. Comparison of experimentally-measured and predicted residual dipolar couplings (RDCs) of PEA-15 death effector domain (DED, residues 1–90).
Experimental RDCs (red) were measured for the PEA-15 in the free (A, B) and ERK2-bound (C–F) forms in two alignment media: filamentous bacteriophage pf1 (A, C, E) and non-ionic C12E5/n-hexanol (B, D, F). Predicted RDCs (blue) were calculated from (A–D) the NMR model structure of free PEA-15 (2LS7) or (E, F) the ERK2-bound form of PEA-15 (4IZ7). The positions of the alpha-helices are indicated by pink bars. The free-form PEA-15 displays excellent agreement between the experimental and predicted RDC values throughout the DED sequence, while the ERK2-bound PEA-15 RDCs only reasonably agree in helices α1, α5, and α6 for both 2LS7 and 4IZ7, indicating a significant reorientation of helices α2, α3, and α4 in the PEA-15/ERK2 complex.

