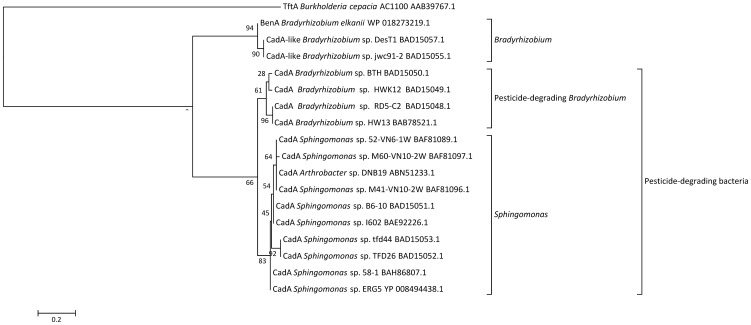
Figure 3. Dendrogram representing the phylogenetic relationship of representative CadA sequences.
Representative sequences for alignment were identified from a BLASTX search using the derived amino acid sequence of CadA from Sphingomonas sp. ERG5 as query. BLASTX hits were picked for comparison with a cutoff value of 50% for amino acid identities. The support of each branch, as determined from 100 bootstrap samples, is indicated as a percentage at each node. Sequences were aligned with T-Coffee (v6.85) [30] and the alignment was curated with Gblocks (v0.91b) [31]. A phylogenetic tree was constructed using a maximum likelihood approach and the JTT substitution model [32] in the PhyML program (v3.0 aLRT) [33], [34]. The resulting unrooted phylogenetic tree was visualized in MEGA4.0.2[35].

