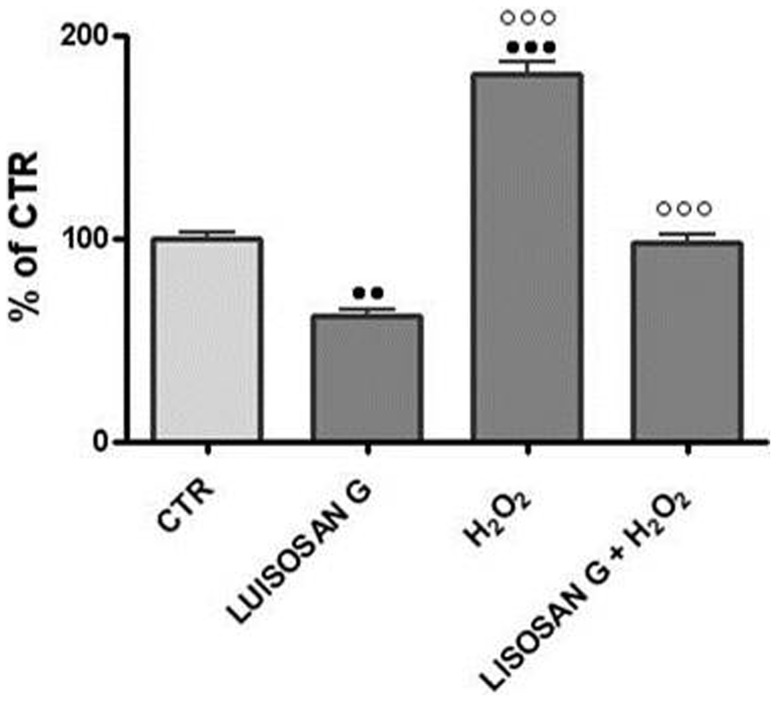
Figure 2. Effect of Lisosan G on lipid peroxidation.
The activity was measured in microsomes from 24 h treated hepatocytes. Results are expressed as percentages of control activity (32.82±2.07 mUA/mg prot.). Mean ± SE of cells from five rats. ••Significantly different from control, p<0.01. ••• p<0.001. ○○○Significantly different from H2O2, p<0.001.

