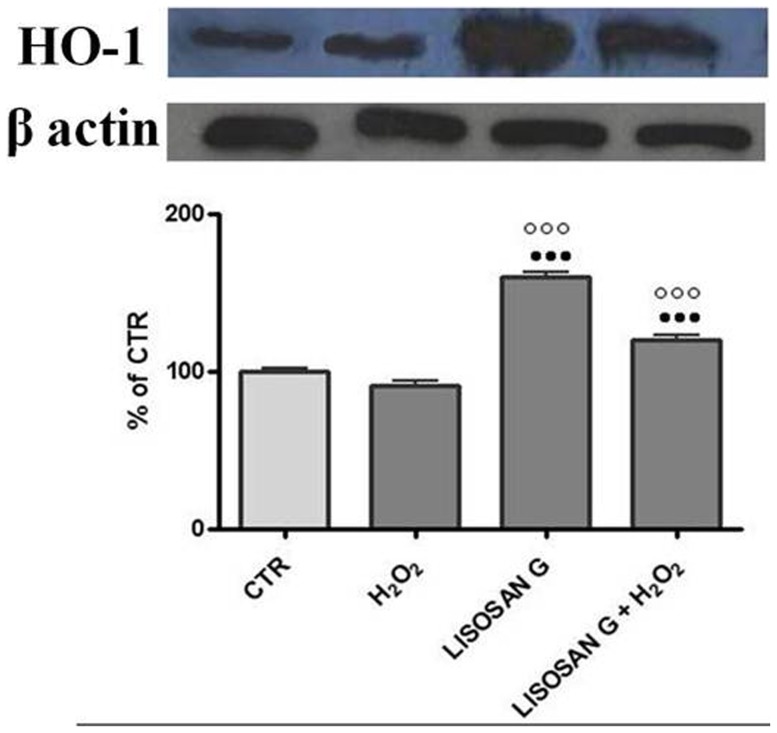
Figure 5. Western blot analysis heme oxygenase-1 protein.
In microsomes (50 µg) of control (CTR) cells and cells treated for 24 h with Lisosan G or Lisosan G+H2O2. Microsomal samples were subjected to SDS-PAGE, electrophoretically transferred to a nitrocellulose membrane, and probed with polyclonal antibodies raised against rat HO-1. Densitometric analysis of the western blot data are shown in the histogram. The results have been normalized to β-actin levels and are expressed as percentages of control. Mean ± SE of cells from five independent experiments using five rats. ••• Significantly different from controls, p<0.001. ○○○ Significantly different from H2O2, p<0.001.

