
Figure 1.
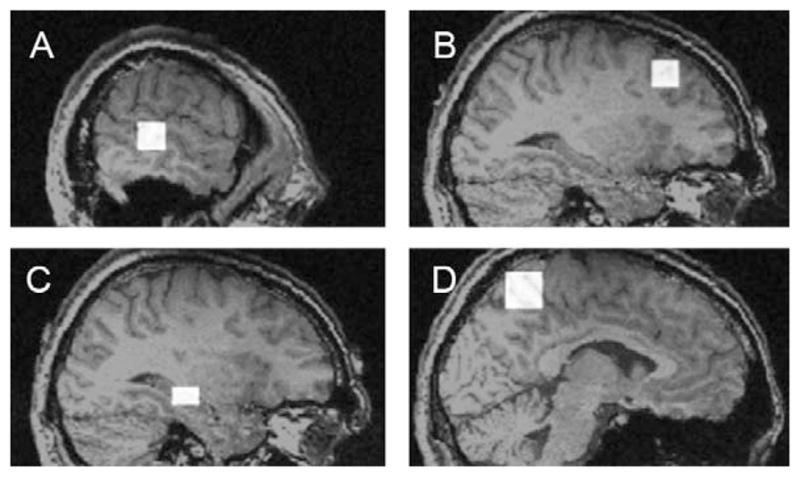
Examples of 4 ROIs to which simulated data was added: (A) left temporal lobe (3 × 3 × 3 voxels), (B) right frontal lobe (3 × 3 × 3 voxels), (C) right hippocampus (2 × 2 × 3 voxels), (D) left parietal lobe (4 × 4 × 4 voxels). Larger versions of each ROI were simulated by increasing each dimension by 1 voxel (i.e. 3 × 3 × 3 would become 4 × 4 × 4 and then 5 × 5 × 5).