
Figure 11.
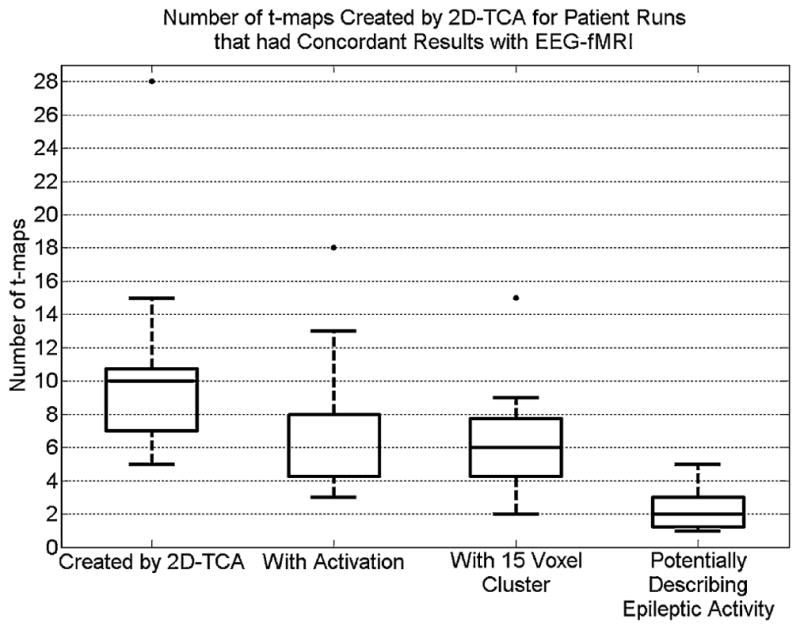
Box plot showing, for runs for which 2D-TCA created a t-map that closely described what was seen in the EEG-fMRI results, the number of t-maps created, number of those created that contain significant activity in the brain, number of those with a cluster of activity of 15 voxels or larger, and number that, in the opinion of the neurologist, could not be ignored and therefore could describe epileptic activity.