
Figure 3.
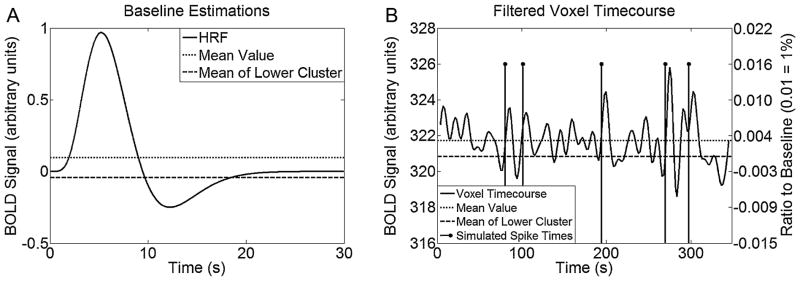
(A) Estimates of baseline for the Glover HRF using the mean and through use of the k-means clustering process. (B) Example of applying k-means to define the baseline value used to normalize a time course containing simulated spikes (right y-axis indicates normalized scale).