
Figure 9.
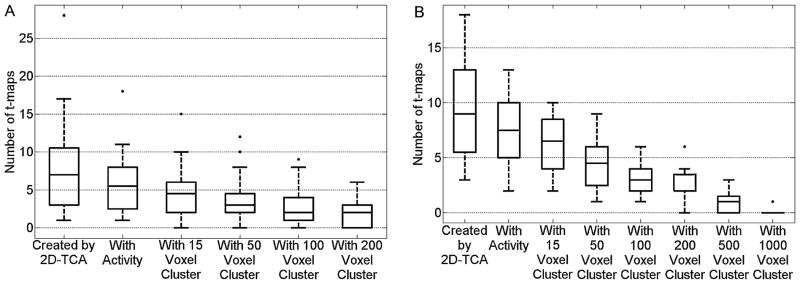
Box plot showing, for (A) the 40 patient runs containing spikes and (B) the 20 patient runs containing prolonged events, the number of t-maps created, number of those created that contain activity in the brain, and number of those that contain a cluster of activity larger than the applied threshold levels.