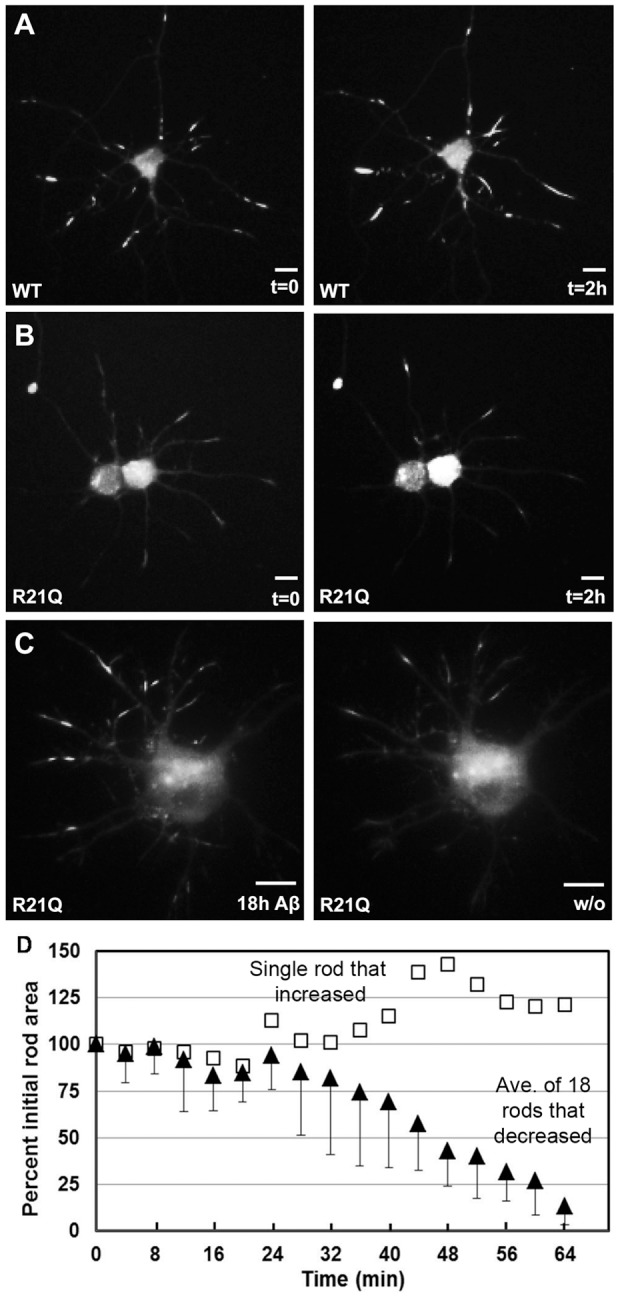
Figure 6. Visualization of rod formation and disappearance in neurons.

Panels from time lapse imaging of neurons expressing cofilin-wt-mRFP (A) or cofilinR21Q-mRFP (B, C). In (A), neurons expressing cofilin-wt-mRFP had spontaneous rods present before imaging and acquired more rods due to photostress during the 2 h of imaging at 30 s intervals. Under identical imaging conditions, neurons expressing cofilinR21Q-mRFP had few spontaneous rods before imaging and did not form new rods during imaging (B). When cofilinR21Q-mRFP expressing neurons were treated with Aβd/t, formation of induced rods could be followed (C) that disappeared following removal of the Aβd/t (image of washout (w/o) is at 60 min). Scale bars = 10 μm. (D) Disappearance of cofilinR21Q-mRFP rods induced by 18 h Aβd/t-treatment in images taken at 4 min intervals after Aβd/t washout (filled triangles). Total area of 18 rods in three separate neurons is plotted vs time after washout as a percent of the area at washout. The half-life of rods following Aβd/t removal is ∼ 47 min. One rod, in a separate neurite of a neuron that contained reversible rods in other neurites, was found to increase in size (open squares) and is presumed to be a spontaneous rod.
