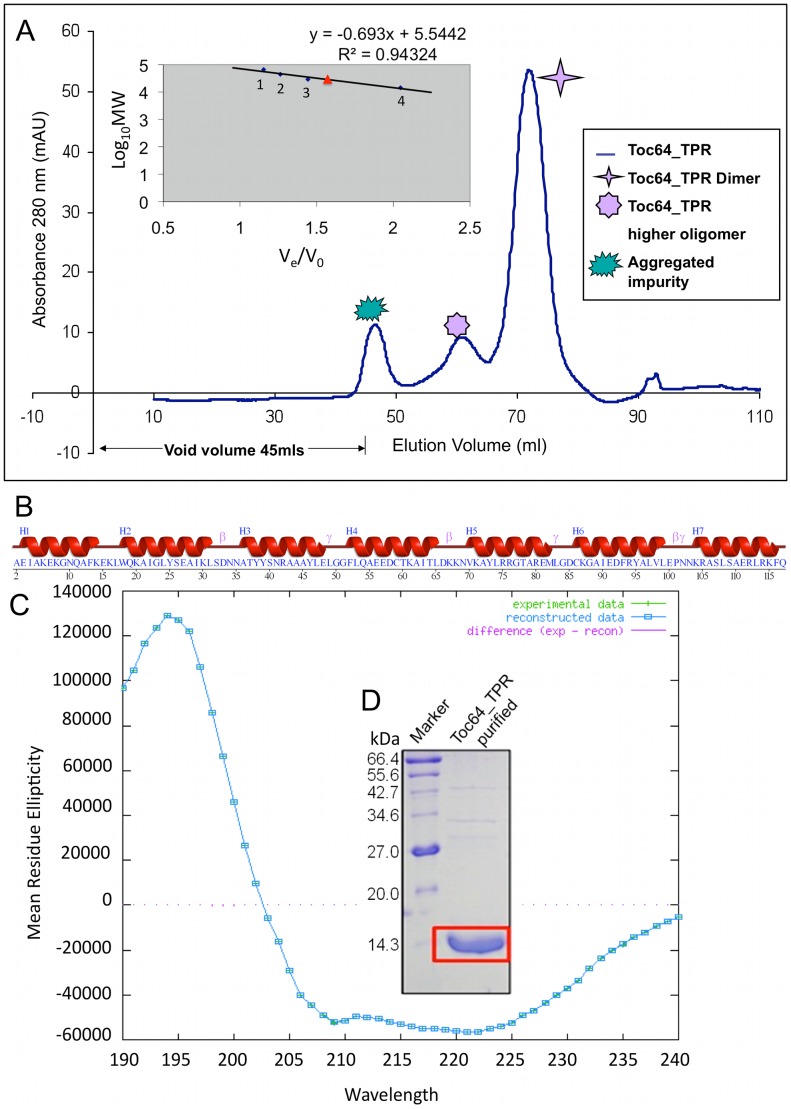
Figure 2. Biophysical characterization of AtToc64_TPR-H6 using size exclusion chromatography and circular dichroism.
A. Elution profile of AtToc64_TPR-H6 from size exclusion chromatography using a Superdex 75 prep grade column. The different shaped stars represent different forms of the protein as described in the figure. The Ve/Vo versus LogMW plot for superdex standards is shown as an inset. Numbers 1–4 represent different standard proteins used as described in the methods. Red triangle represents AtToc64_TPR-H6. B. Schematic representation of secondary structure of AtToc64_TPR. C. CD spectrum profile of the protein obtained after analysis with DICHROWEB.

