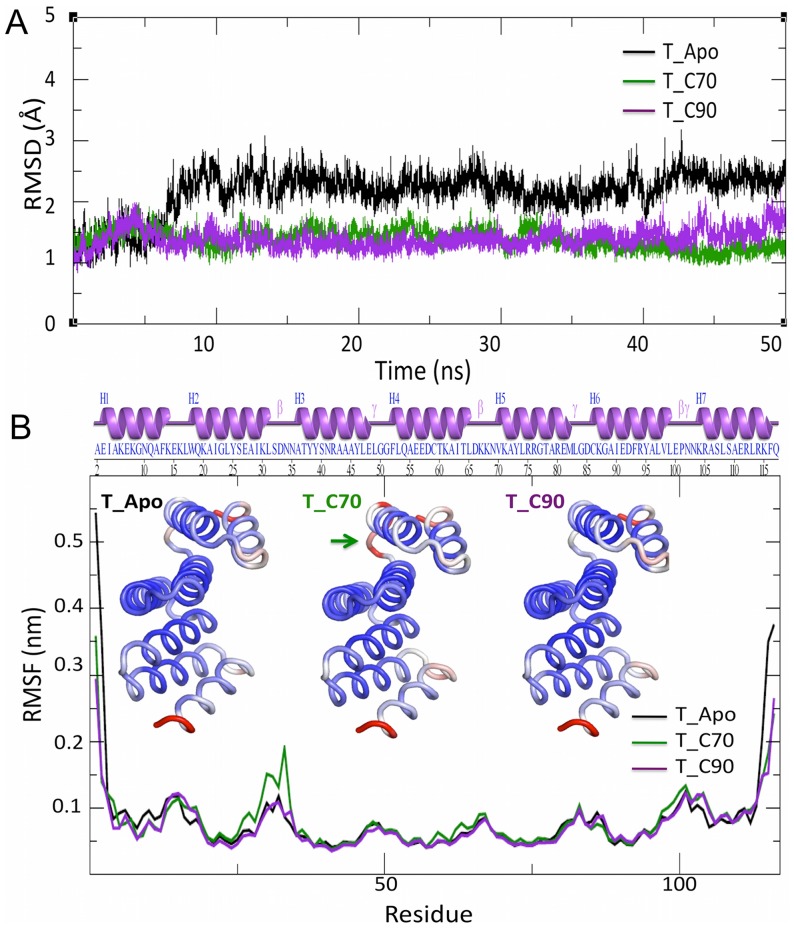
Figure 5. Analysis of the molecular dynamics trajectory obtained after 50 A.
Root mean square deviation (RMSD) plot for the apo TPR receptor (black trace), the Hsp70 C-terminal octapeptide bound form of the receptor (T_70: green trace) and the Hsp90 C-terminal octapeptide bound form of the receptor (T_C90: magenta trace). B. The atomic positional fluctuation (RMSF) plot obtained for each of the above systems. The loop with high B factors in T_C70 is shown with a green arrow.

