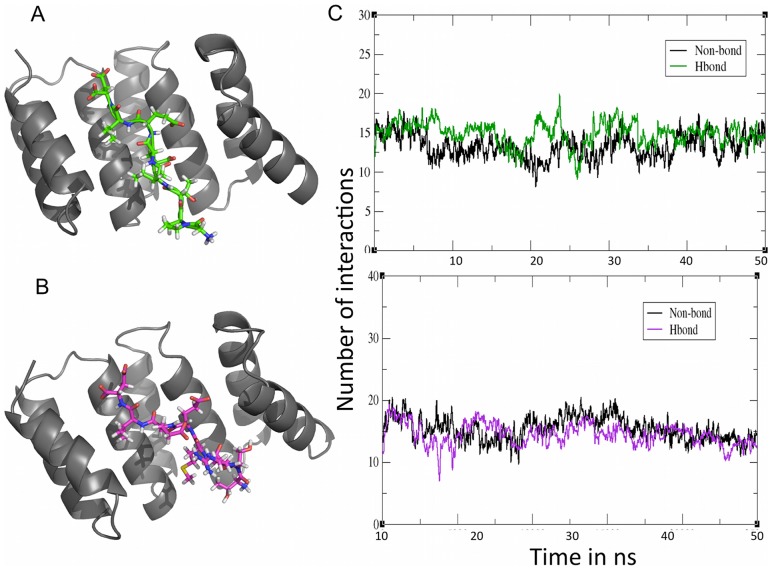
Figure 6. Characterization of the average structures obtained after simulation of the complexes.
A. The TPR domain with bound octapeptide from Hsp70 (green) B. The TPR domain with bound octapeptide from Hsp90 (magenta) C. Number of interactions in the T_C70 system (green) and in the T_C90 system (magenta) during the simulations.

