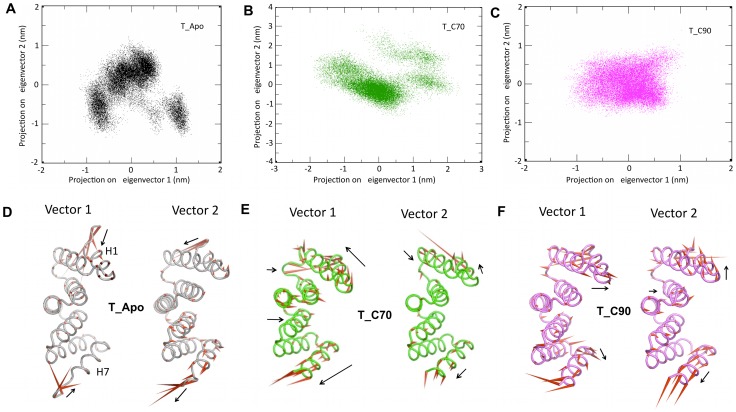
Figure 10. Principal component analysis for the three systems.
Essential dynamics -2D projection of individual trajectories with their first two eigen vectors: vector 1 and vector 2 (A–C) and their corresponding porcupine plots (D–F) for T_Apo (black), T_C70 (green) and T_C90 (magenta). Porcupine plots of the three systems displayed with a cone model. The length and orientation of the cone (red) is positively correlated with the magnitude and direction of motion.

