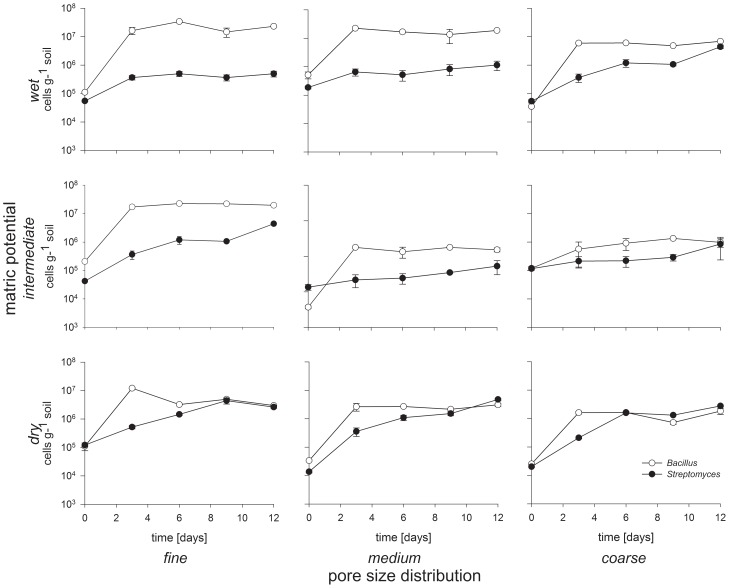
Figure 4. Population dynamics of Streptomyces and Bacillus competing in nine different combinations of pore size distribution and matric potential.
The x-axis is time in days and the y-axis is cell number (g drywt soil) on a log-scale. Each data point is the mean of three microcosm replicates. Error bars show the standard deviation.

