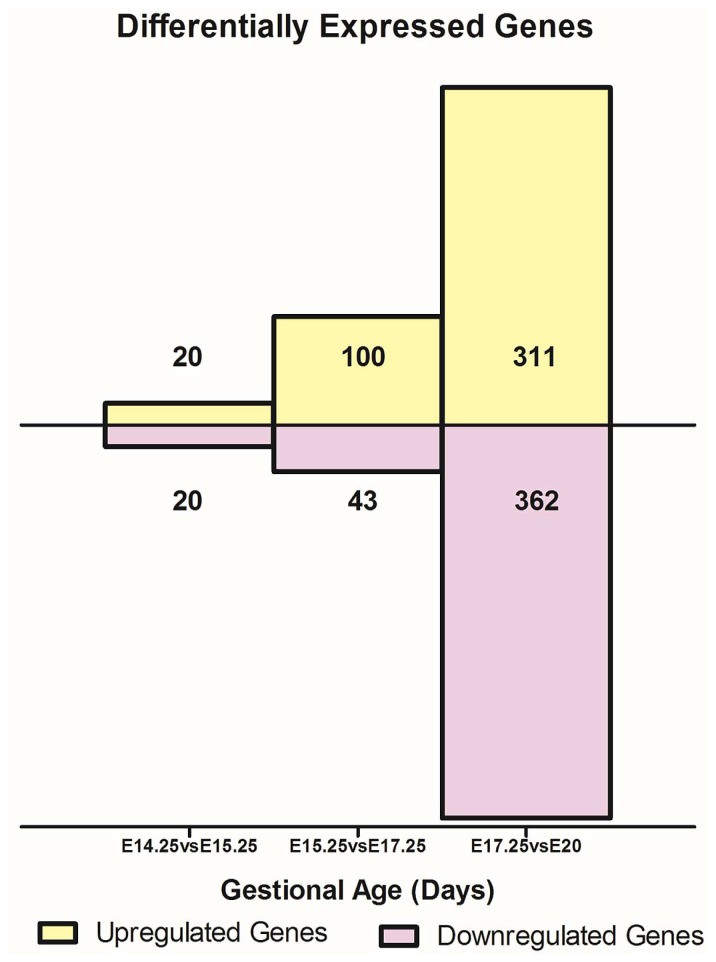
Figure 1. Differentially genes expression during gestation.
A) The total number of differentially expressed genes that were up and down regulated between the 3 gestational groups i.e. E14.25 vs. E15.25, E15.25 vs. E17.25 and E17.25 vs. E20 are displayed as fold change (cut-off >2 and FDR<1%). B) Overall gene expression fold changes from the earliest time point under study E14.25 right up to E20.

