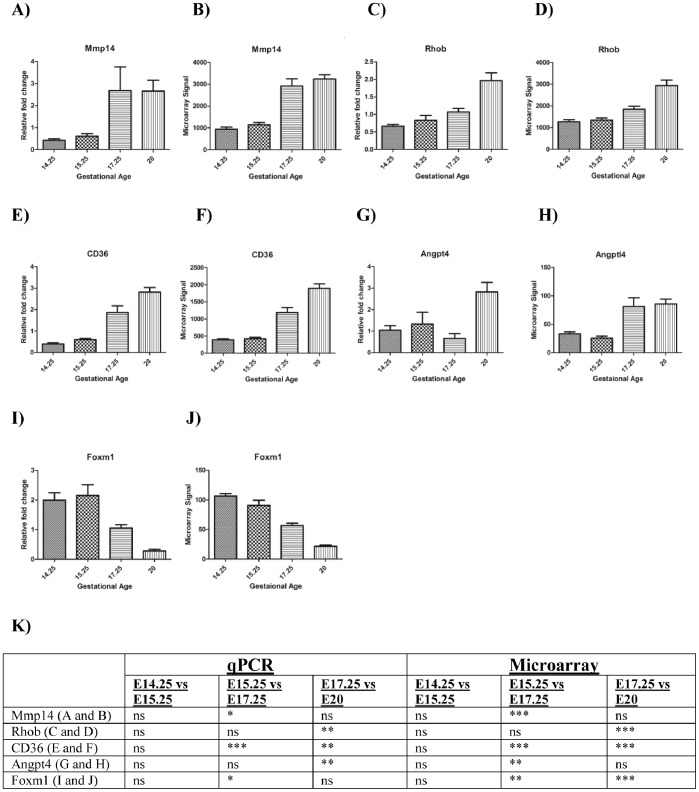
Figure 5. qPCR validation of 5 Angiogenic genes.
For Mmp14, qPCR are microarray data are presented in panels A and B, respectively; for Rhob in panels C and D; for CD36 in panels E and F; for Angpt4 in panels G and H; for Foxm1 in panels I and J. Statistical significance (p values) is presented in panel K. Where p<0.05 = *; p<0.0005 = **; p<0.0001 = *** as assessed by one way ANOVA and post-hoc tests (Bonferroni test). The x-axes in all graphs represent the 4 gestational age groups. Y-axes for qPCR graphs denote relative fold change normalised to β-actin. The y-axes for the microarray bar charts denote microarray hybridisation signals.

