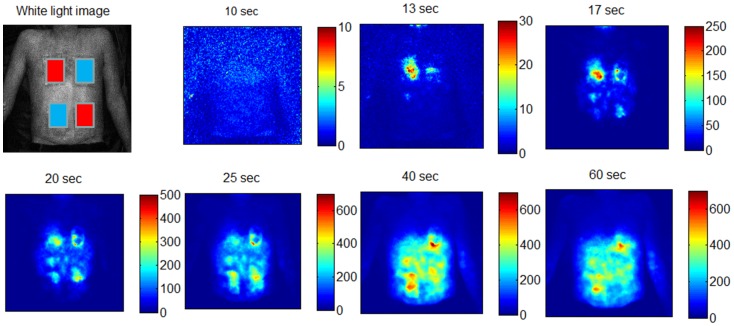
Figure 5. Fluorescence image time series after modulating local skin perfusion with heat and cold.
Upper left: White light image of the subject’s upper body overlaid by the positions of the two warm and cold pads. Pads were placed on the upper body for 5 minutes and removed right before ICG bolus injection and fluorescence imaging started. While heat leads to an increase in skin perfusion due to auto-regulated vasodilation, releasing the cold pad leads to a protective vasodilator effect which is by comparison delayed. Color coding of fluorescence intensity (a.u.) is individually scaled for each image.

