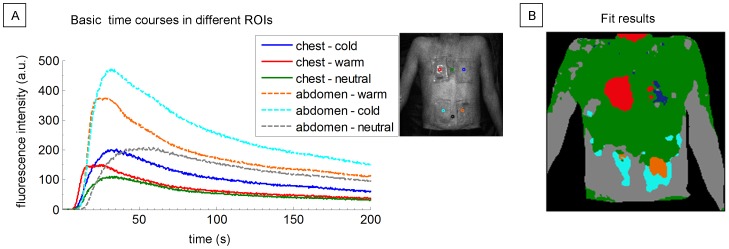
Figure 7. Color-coded mapping of areas with similar temporal behavior.
A: Mean fluorescence basis time courses in six different regions of interest (ROIs) after modulating local skin perfusion with heat and cold on chest and abdomen. B: Color-coded fitting results mapping areas with temporal behavior similar to the extracted basis time courses calculated by a nonnegative least square fit.

