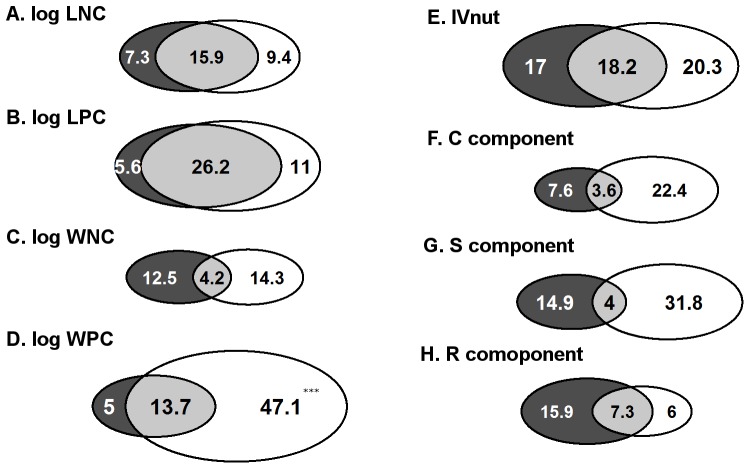
Figure 1. Partitioning of among-site plant trait variation.
Trait variations (in percentage of variance) are divided into unique effects of soil N measures (dark grey), unique effects of soil P measures (white), and shared effects of both (light grey). Examined plot-mean plant traits are A: log-transformed leaf N concentration, LNC (mg/g) (n = 51), B: log-transformed leaf P concentration, LPC (mg/g) (n = 51), C: log-transformed N concentration of above-ground plant biomass, WNC (mg/g) (n = 82), D: log-transformed P concentration of above-ground plant biomass, WPC (mg/g) (n = 82), E: indicator value for nutrients, IVnut (n = 134), F: C component (n = 134), G: S component (n = 134), and H: R component (n = 134). When the contribution of N or P measures to the total explained variance is significantly larger than the other, this is indicated by asterisks (***: p<0.001).

