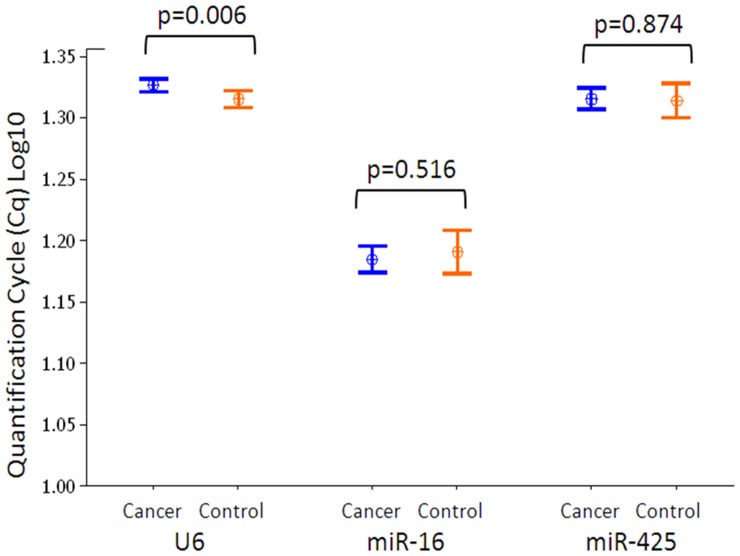
Figure 4. Relative quantity candidate ECs.
Relative quantity of candidate EC miRNAs in blood of breast cancer patients (blue, n = 40) and healthy controls (n = 20) expressed as quantification cycle (Cq) values. Interval plots display the mean and 95% confidence interval. There was no significant difference (p>0.05, t-test) for miR-16 and miR-425. However, U6 was more abundant in the control group (p = 0.006).

