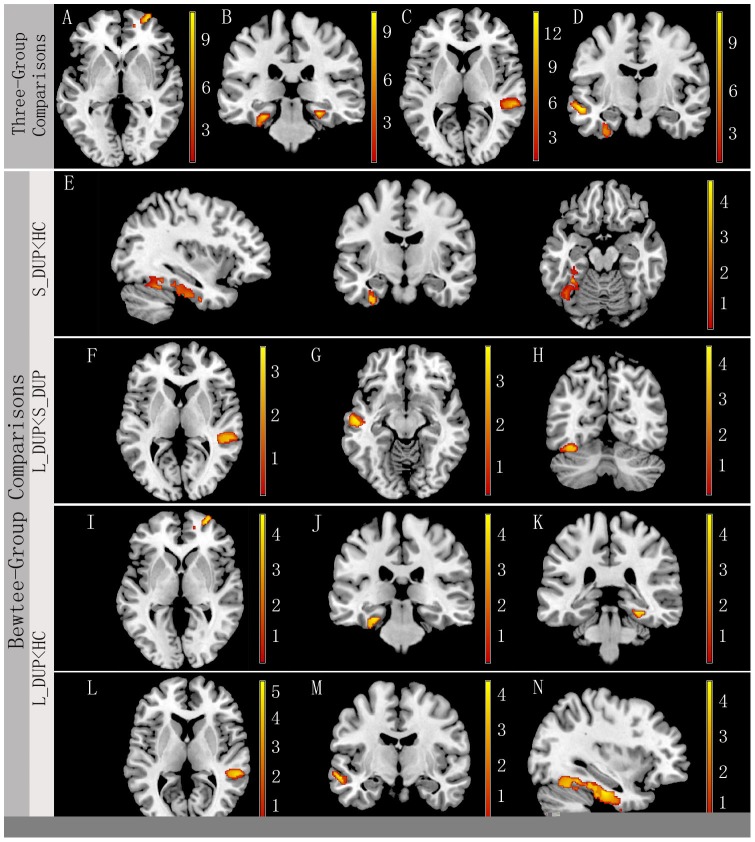
Figure 1. Brain anatomical regions that showed significant difference in gray matter volume among the three groups (right is right).
A) right superior frontal gyrus, B) bilateral parahippocampus gyri, C) right superior temporal gyrus, and D) left fusiform and middle temporal gyri. Post-hoc analysis further suggested that the S-DUP group had significantly decreased gray matter volume in E) left fusiform gyrus compared with healthy control subjects, and significantly increased gray matter volume in F) right superior temporal gyrus, G) left middle temporal gyrus, and H) left fusiform compared with the L-DUP group. Compared with healthy control subjects, the L-DUP group had significantly decreased gray matter volume in I) right superior frontal gyrus, J) and K) bilateral parahippocampus gyrus, L) right superior temporal gyrus, M) left middle temporal gyrus, and N) left fusiform gyrus. Of note, statistical maps between L-DUP vs. Healthy control subjects were corrected for multiple comparisons using FDR (p<0.05), while those between L-DUP vs. S-DUP, and S-DUP vs. Healthy control subjects were corrected for multiple comparisons at the significant level of p<0.01 using AlphaSim Program (an extent threshold of p<0.01 with a minimum cluster size of 731 voxels).

