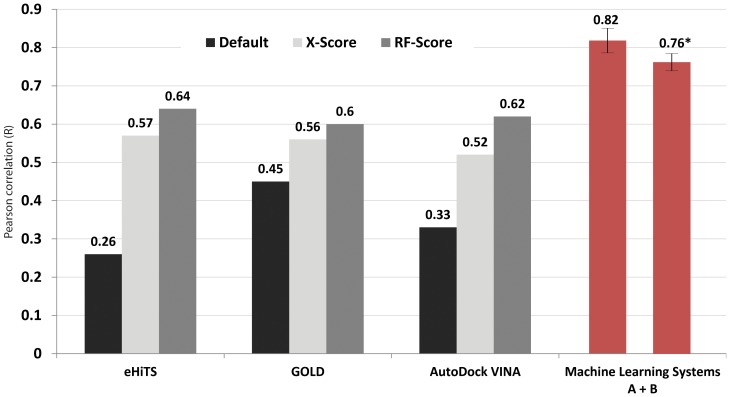
Figure 1. Comparison of prediction accuracy using different docking approaches.
Validation data included the 1300 protein-ligand complexes of PDBbind version 2007. Values were the correlations between calculated docking scores and corresponding experimentally determined binding affinities. Black bars indicate results using default scoring functions equipped with docking tools. Gray bars are those re-scored with external scoring functions (e.g. X-Score and RF-Score) after docking. Red bars represent averages of 25 random test/training partition tests using machine learning systems A + B, and the one with an asterisk is the test using PDBbind version 2012 (2897 complexes) dataset. Error bars = ± one s.d. External re-scoring functions improved the correlations compared with the employment of docking simulations alone. The application of machine learning systems A + B was the most effective.

