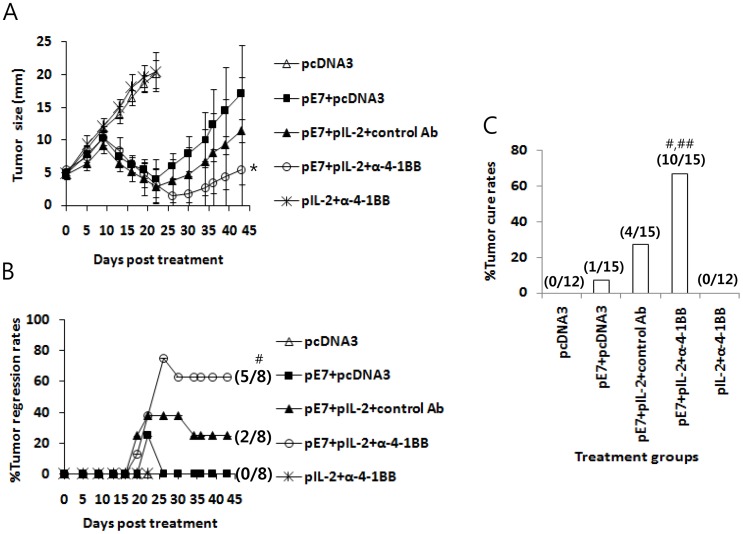
Figure 3. Antitumor therapeutic activity of the E7 DNA vaccine regimen (E7 DNA vaccines+IL-2 cDNA) plus anti-4-1BB Abs.
(A) Each group of mice (n = 6–8) was challenged s.c. with 2×10⁵ TC-1 cells per mouse. When the tumor sizes reached approximately 5 mm, the animals were injected by IM-EP with 50 µg of E7 DNA vaccines (pE7) plus 10 µg of IL-2 cDNA (pIL-2) per mouse in a final volume of 50 µl at 0, 4, and 11 days. The animals were also injected i.p. with 100 µg of anti-4-1BB and control rat Abs at 0, 1 and 2 weeks. The tumor sizes were measured over the entire time course (A). The values and bars represent the mean tumor sizes and SD, respectively. Simultaneously, animals showing complete tumor regression were counted over the time points and the % tumor regression rates were calculated (B). The numbers in (/) denote the number of mice showing complete tumor regression for 120 days after treatment/the number of mice tested. (C) The percentage of mice showing complete tumor regression for 120 days after treatment. The numbers in (/) denote the number of mice showing complete tumor regression for 120 days after treatment/the total number of mice tested in two separate studies. *p<0.05 using one-way ANOVA compared to pE7+pcDNA3. #p<0.05 using Chi-square test compared to pE7+pcDNA3. ##p<0.05 using Chi-square test compared to pE7+pIL-2+control Abs.

