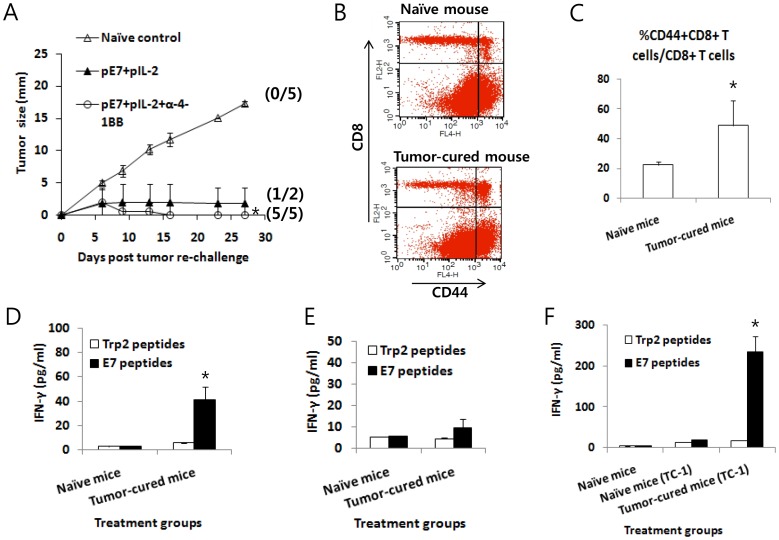
Figure 4. Induction of long-term antitumor memory responses by the E7 DNA vaccine regimen (E7 DNA vaccines+IL-2 cDNA) plus anti-4-1BB Abs.
(A) Five tumor-cured mice treated with pE7+pIL-2+anti-4-1BB Abs (from Fig. 3B) and 2 tumor-cured mice treated with pE7+pIL-2+control Abs (from Fig. 3B) were re-challenged s.c. with 4 x 10⁵ TC-1 cells per mouse at 120 days post-first treatment. The tumor size was measured over time, and the mean tumor size was recorded. The values and bars represent the mean tumor sizes and SD, respectively. The numbers in (/) indicate the number of mice showing tumor regression for 270 days post-re-challenge/the number of mice tested. (B,C,D) Three of the 5 mice that received tumor cell re-challenge and rejected their tumors (from Fig. 4A) were sacrificed at 270 days post-tumor re-challenge and the spleens were removed for immune cell isolation. The immune cells were tested for the level of the CD44highCD8+ T cell population among CD8+ T cells (B,C) and for the level of IFN-γ induction (D). Fig. 4B shows one representative figure displaying the level of CD44highCD8+ T cells. Fig. 4C shows the mean percentage of CD44highCD8+ T cells in each group and SD. Fig. 4D shows IFN-γ levels after in vitro stimulation with either E7 or control Trp2 peptides. (E,F) In another set of mice from a tumor treatment study, 3 of 5 tumor-cured mice following treatment with E7 DNA+IL-2+anti-4-1BB were sacrificed at 120 days post-treatment and the spleens were removed for immune cell isolation. The immune cells were used for IFN-γ assays (E). The remaining two mice from Fig. 4E were re-challenged with TC-1 cells (2×10⁵ cells/mouse) at 138 days post-treatment in parallel with naïve mice. The mice were sacrificed at 18 days post-re-challenge and the spleens were removed for an IFN-γ assay (F). (E,F) show the IFN-γ levels in each group. The values and bars represent the mean IFN-γ levels of each test group and SD. *p<0.05 using one-way ANOVA compared to naïve control.

