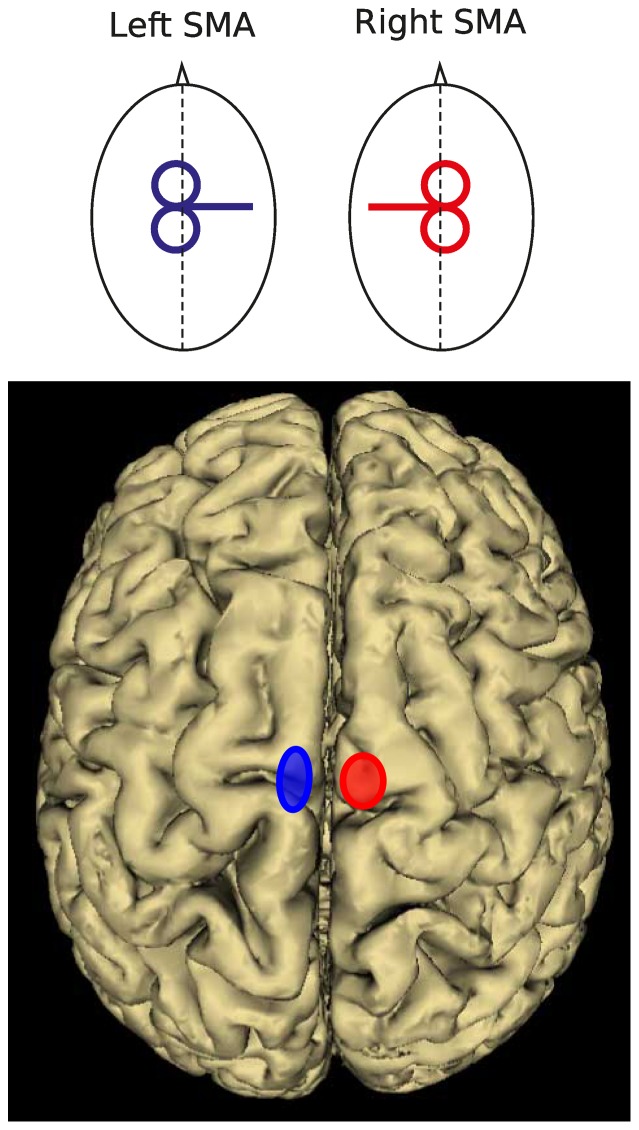
Figure 1. Coil position for optimal stimulation of left and right SMA (top) and mean location of the stimulation points over left (blue; −6.6, −6.4, 73.5; x, y, z) and right (red; 8.6, −6.9, 73.2; x, y, z) SMA following normalization into the MNI space (bottom).
The centre of each ellipse is located over the mean MNI coordinates of each stimulation site. The area of the ellipses indicates the 95% confidence interval.

