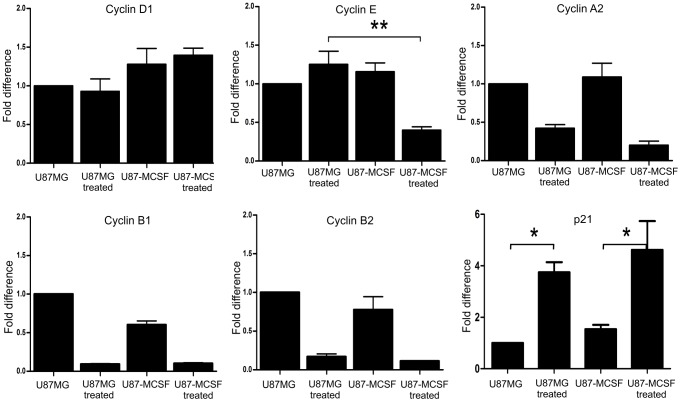
Figure 4. Real time PCR analysis to show the expression levels of various cyclins and p21.
A significant decrease in the expression of cyclin E and a slight decrease in the expression of cyclin A2 was observed in treated U87-MCSF cells, which correlated with the elevated G0/G1 accumulation of cells seen in cell cycle analysis. The expression of p21, the cyclin dependent kinase inhibitor was increased in treated samples of both U87MG and U87-MCSF cells. Statistical significance is denoted by * (p<0.05), ** (p<0.01) and *** (p<0.001).

