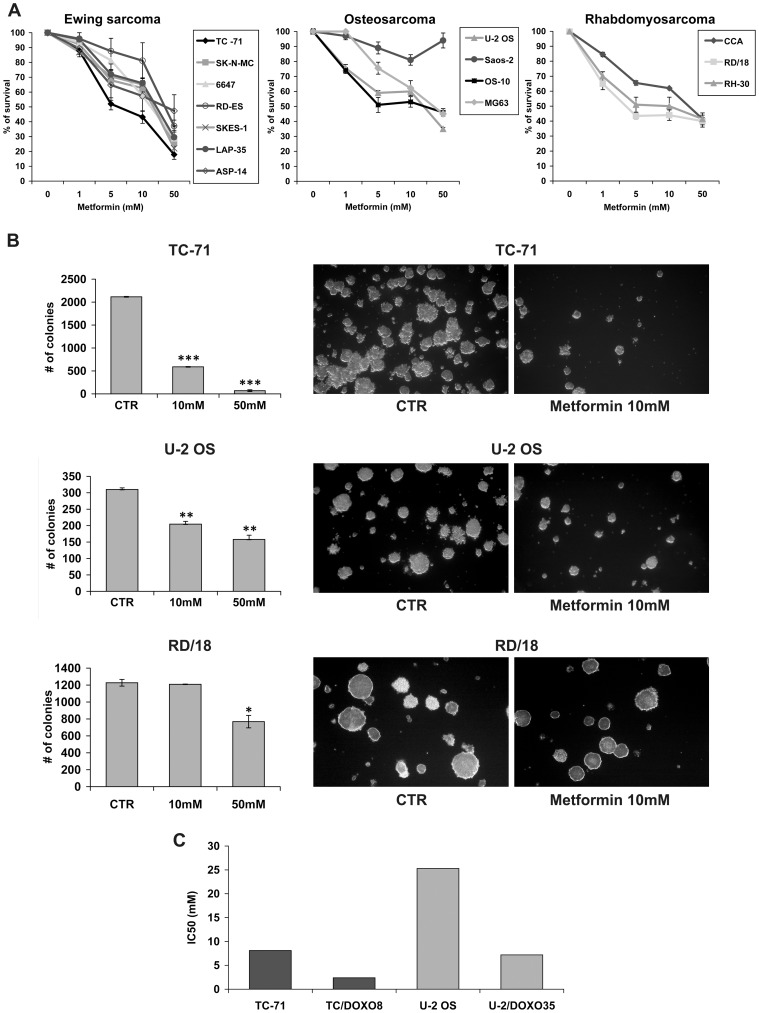
Figure 1. In vitro sensitivity of Metformin in sarcomas.
A) Cell growth was assessed by MTT assay after 72h exposure to Metformin (mM) in seven Ewing sarcoma, four Osteosarcoma, and three Rhabdomyosarcoma cell lines and displayed as a percentage of survival over controls. Points, mean of two independent experiments; bars, SE. B) Effects of metformin on sarcoma cells in anchorage independent conditions. Number of colonies was determined after 7–10 days of growth in IMDM 10% FBS. Columns, mean of three independent experiments; bars, SE. Bars: mean of three experiments ± SE. *P < 0.05, ** P<0.01, ***P < 0.005 statistically significant differences by Student’s t test. Representative pictures of the effects of the inhibitor on colonies formation in soft agar. Magnification x40; C) IC50 values of metformin in Ewing sarcoma (TC/Doxo8) and osteosarcoma (U-2OS/Doxo35) chemoresistant cell lines.

