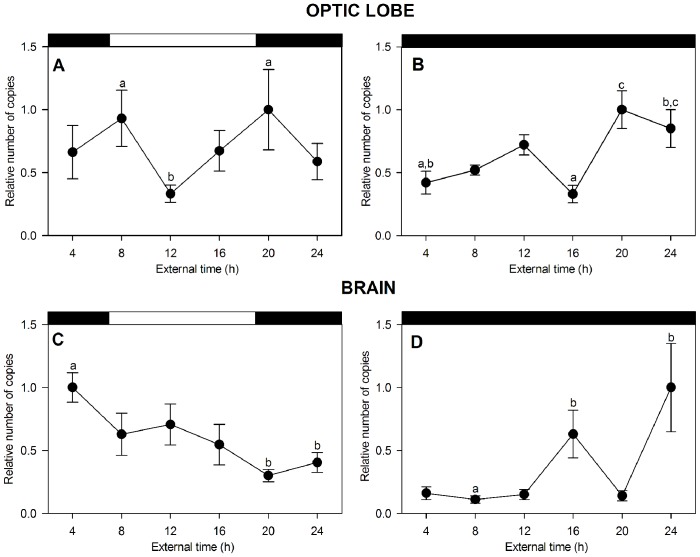
Figure 2. CHH mRNA levels daily and circadian oscillations in eyestalk and brain of P. clarkii.
Chronograms showing rhythmic CHH mRNA expression in the optic lobe (A, B) and brain (C, D) under 12∶12 light–dark cycles and continuous darkness. Data are the mean ± standard error (SE) (n = 6). The results are expressed relative to the highest level of expression in each graph. The upper black and white bars in each graph denote the light and dark phases. Different letters above some time points represent statistically significant differences (post hoc analysis, LSD); please see the text for the explanation.

