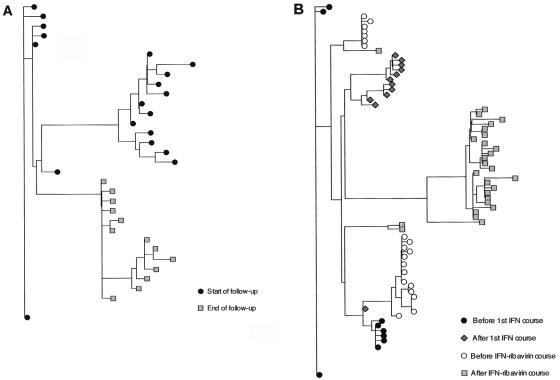
FIG. 3.
Examples of phylogenetic trees plotted with the quasispecies variant nucleotide sequences isolated at the various points of follow-up. (A) Phylogenetic tree plotted with patient A's quasispecies sequences isolated at the start and end of follow-up, respectively. (B) Phylogenetic tree plotted with patient C's quasispecies sequences isolated before and after IFN monotherapy and before and after IFN-ribavirin combination therapy.

