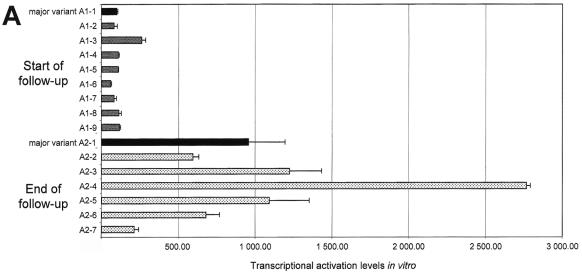
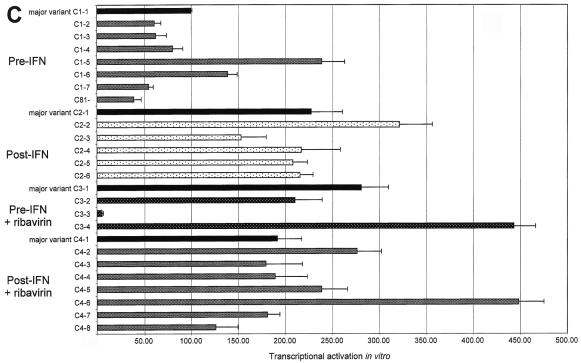
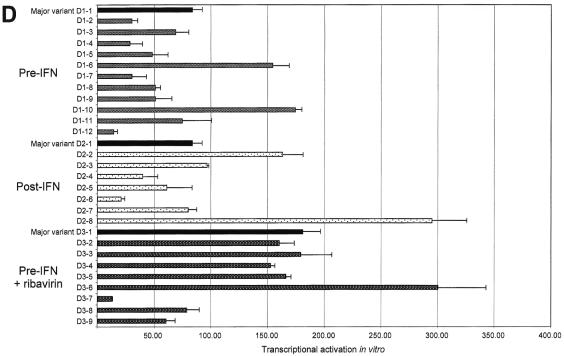
FIG. 4.
Transcriptional activation by HCV NS5A variants, as measured in an in vitro yeast assay. Panels A to D show data for patients A to D, respectively. The quantitative results are shown in RU, where 1 RU = RC/100 (RC is the transcriptional activation level obtained with the major variant in patient C's initial sample). At each time point, the most frequent quasispecies variant (major variant) is shown in black and is followed from top to bottom by the other variants isolated in the same quasispecies mixture. Each bar represents the mean ± standard deviation of three experiments performed in duplicate. Note that the same unit (RU) has been used in all four panels, but the scales of the panels differ due to different average levels of transcriptional activation in the four patients.


