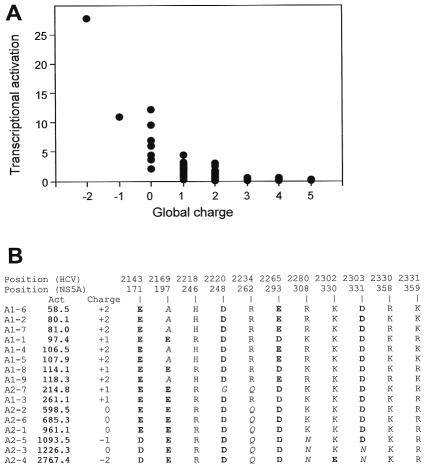
FIG. 5.
Correlation between the global charge of NS5A region 2141 to 2332 (169 to 360) and in vitro transcriptional activation efficiency. The global charge of each NS5A sequence was calculated by attributing a “+1” charge for each basic residue (R, K, and H) and a “−1” charge for each acidic residue (D and E). (A) Plot of the global charge of all of the quasispecies variants isolated from the four patients versus their transcriptional activation efficiency. (B) Summary of charge variations in patient A's quasispecies. The sequences of the nine variants isolated at the start of follow-up are designated A1-i, where i varies from 1 to 9, while the seven sequences isolated at the end of follow-up are designated A2-j, where j varies from 1 to 7. The “Act.” column displays in vitro transcriptional activation efficiency in RU, where 1 RU = RC/100 (RC is the transcriptional activation level obtained with the major variant in patient C's initial sample). The variants are ordered by increasing transcriptional activation efficiency, from top to bottom. The global charge of the corresponding variant is shown in the “Charge” column. The composition in charged residues at basic and acidic positions is shown.

