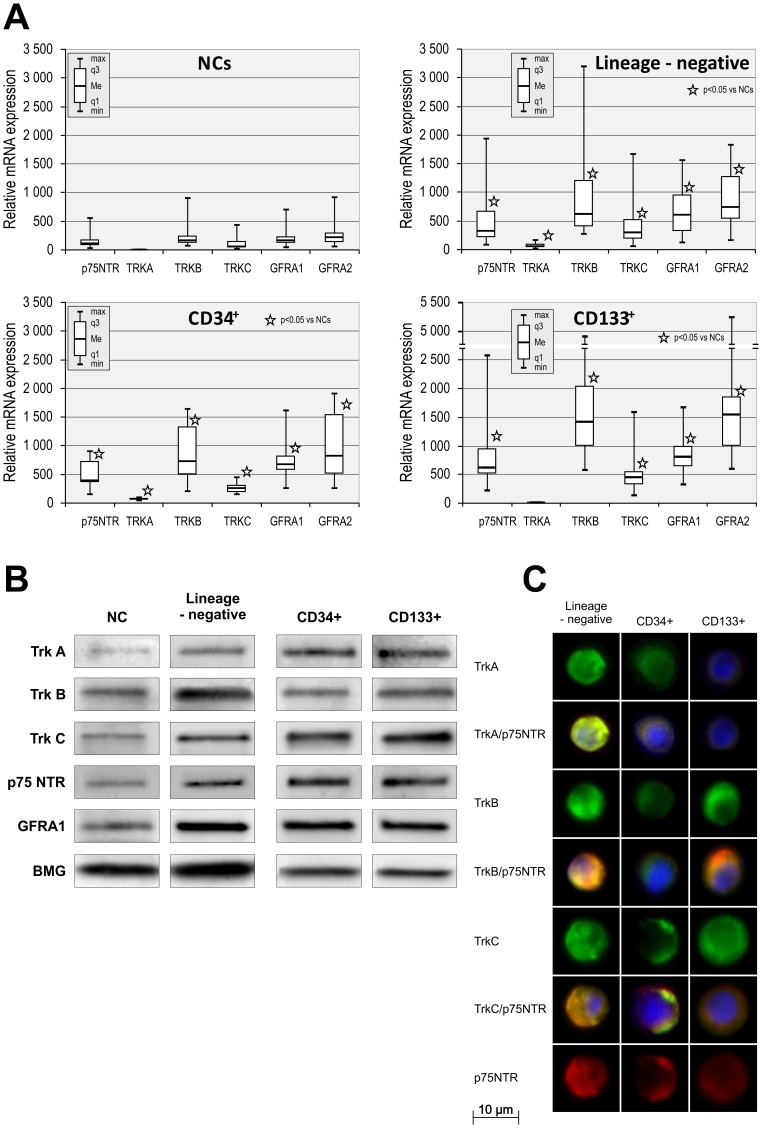
Figure 2. UCB SPC populations continuously express neurotrophin receptors.
(A) NT receptor mRNA expression levels in UCB-derived nucleated cells, lineage-negative, CD34+, and CD133+ cell populations. Relative mRNA expression values are normalized against BMG levels. Data are shown as median, quartiles, interquartile range, minimum, and maximum for six independent experiments. *P<0.05 versus NCs (the exact statistical difference is presented in the Results). (B) Representative western blot analysis of NT receptor protein levels in SPC lysates. (C) Immunofluorescent analysis of NT receptor expression on the surface of SPCs. Nuclei were visualized by DAPI staining. Pseudo-coloring was assigned to each stain as follows: anti-TrkA, anti-TrkB, and anti-TrkC – green, anti-p75NTR – red, and nuclei – blue. All images were captured using the Pathway Bioimager System (BD Biosciences, Rockville, MD, USA). Representative data are shown from three independent experiments.

