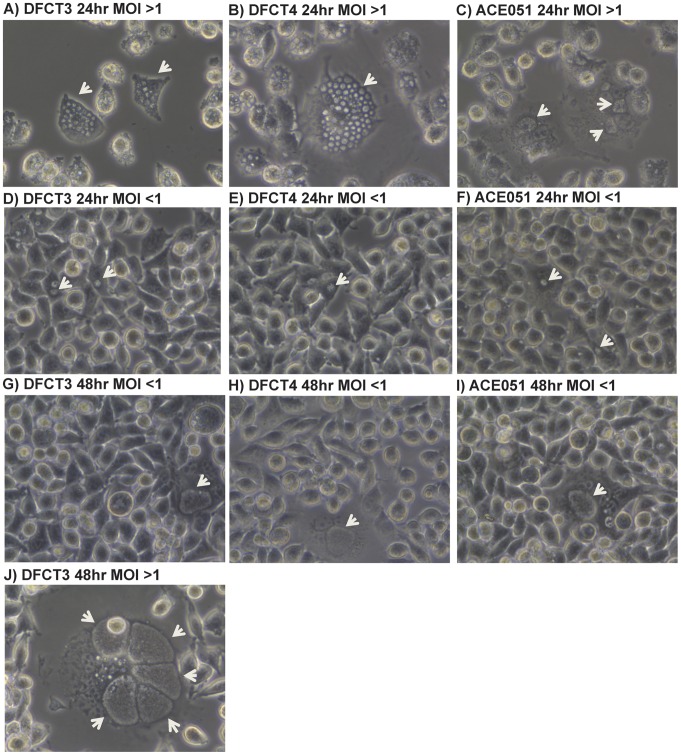
Figure 4. Formation of non-fusogenic inclusions by incA::GII(bla) mutants in a cell culture infection model.
Cells were infected at an MOI of ∼10 (panels A–C), ∼5 (panel J), or ∼0.1 (panels D–I) with ACE051, DFCT3, or DFCT4 and viewed under 400× phase contrast at 24 (panels A–F) or 48 hours (panels G–J) post infection. White arrows designate the location of inclusions. Images are representative of three independent experiments.

