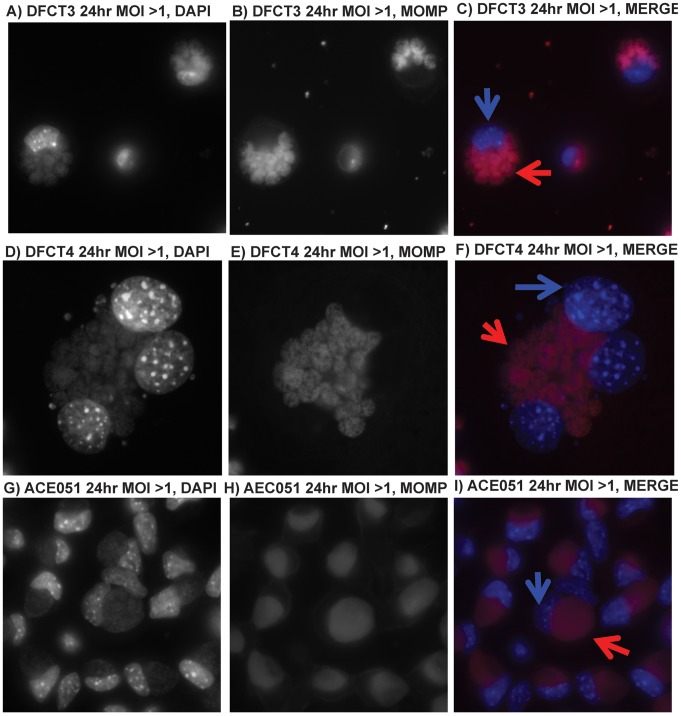
Figure 5. Immunofluorescence analysis of incA::GII(bla) mutants.
Cells were infected at an MOI of ∼10 with ACE051, DFCT3, or DFCT4. After 24 hours post infection, cells were fixed for immuno-probing with mouse anti-MOMP antibodies to detect Chlamydia, panels B/E/H (visualized with a goat anti-mouse Texas Red conjugated secondary antibody), and stained with DAPI, panels A/D/G. For image overlay analysis, anti-MOMP images were false colored red and DAPI images were false colored blue. The resulting overlays are shown in panels C/F/I. Blue arrows in panels C/F/I highlight cell nuclei while red arrows highlight inclusions. All images were taken under oil immersion at 630× using a fluorescent microscope. Infections and immuno-processing were performed three times.

