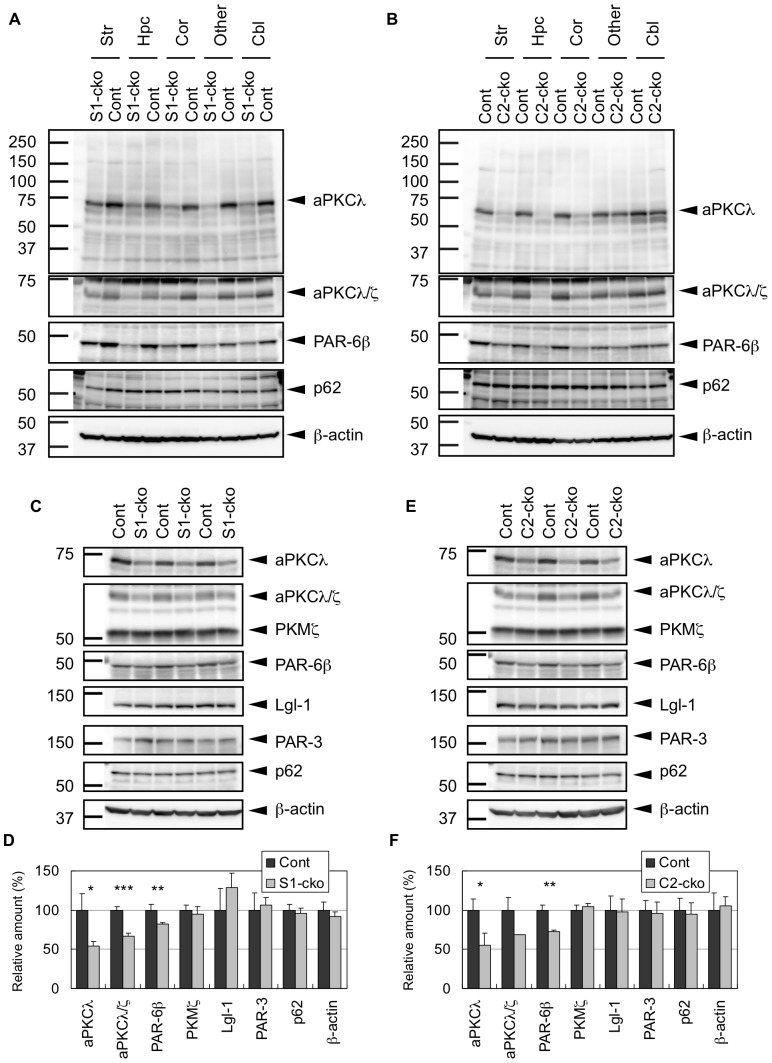
Figure 2. Western blot analysis of aPKCλ and its interacting proteins in the brain of aPKCλ deletion mice.
(A) Brains of 7-month-old female mice harboring aPKCλ flox/−; S1-cre (S1-cko) or flox/+ (Cont) were separated into five regions: striatum (Str), hippocampus (Hpc), cortex (Cor), other remaining cerebrum regions (Other) and cerebellum (Cbl). These tissue regions were subjected to Western blot analysis using antibody specific to aPKCλ (BD, 610175) or antibody recognizing both aPKCλ/ζ (Santa Cruz (SC), sc-216). Antibodies for PAR-6β, p62 and β-actin were also used for the analysis. (B) Brains of 13-month-old female mice harboring aPKCλ flox/+ (Cont) or flox/flox; C2-cre (C2-cko) were separated and analyzed as in (A). (C) Total cerebrum of 11-month-old female mice harboring aPKCλ flox/flox; S1-cre (S1-cko; n = 3) or flox/flox (Cont; n = 3) were subjected to Western blot analysis using anti-aPKCλ (BD) or anti-aPKCλ/ζ (SC). An alternative isoform of aPKCζ, PKMζ was also detected by anti-aPKCλ/ζ (SC). Antibodies for PAR-6β, PAR-3, Lgl-1, p62 and β-actin were also used for the analysis. (D) Bands in (C) were quantified and plotted. (E) Total cerebrum of 20-month-old female mice harboring aPKCλ flox/flox; C2-cre (C2-cko; n = 3) or flox/flox (Cont; n = 3) were subjected to Western blot analysis as in (C). (F) Bands in (E) were quantified and plotted. Values are means ±SD (*P<0.05, **P<0.01, ***P<0.001).

