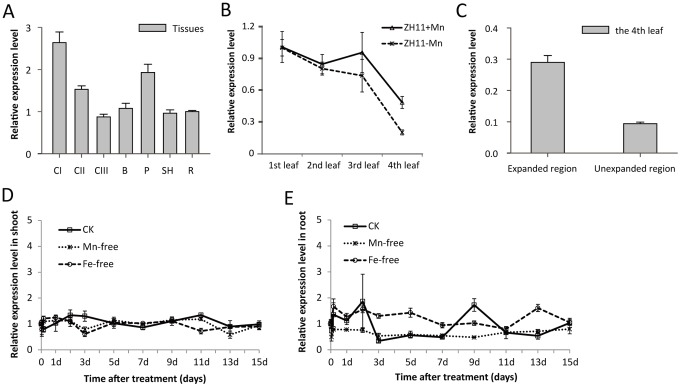
Figure 1. Expression analysis of OsNRAMP3 by real-time RT-PCR.
(A) The relative expression level of OsNRAMP3 in different rice tissues. C1: first culm; CII: second culm; CIII: third culm; B: leaf blade; P: panicle; SH: leaf sheath; R: root. (B) Transcripts of OsNRAMP3 of different leaves under different Mn conditions. The leaves detected here were sampled from the same tiller of rice plants – with the first leaf the oldest and the fourth leaf the youngest and partly wrapped in the leaf sheath. The plants were cultivated hydroponically under normal conditions for two weeks and then shifted to Mn-replete or Mn-free conditions for an additional one week. ZH11: cv. Zhonghua 11. (C) Expression analysis of OsNRAMP3 in different regions of the fourth leaf. (D and E) Kinetics of the response of OsNRAMP3 to Mn or Fe deficiency in shoot (D) and root (E) of rice plants. The plants were cultivated hydroponically under normal conditions for two weeks and then shifted to different conditions for treatment. Data are means ± SD (n = 3).

